
Fig. 5
- ID
- ZDB-IMAGE-160928-5
- Publication
- Hilinski et al., 2016 - Lmx1b is required for the glutamatergic fates of a subset of spinal cord neurons
- All Figures
- Figures for Hilinski et al., 2016
|
Fig. 5
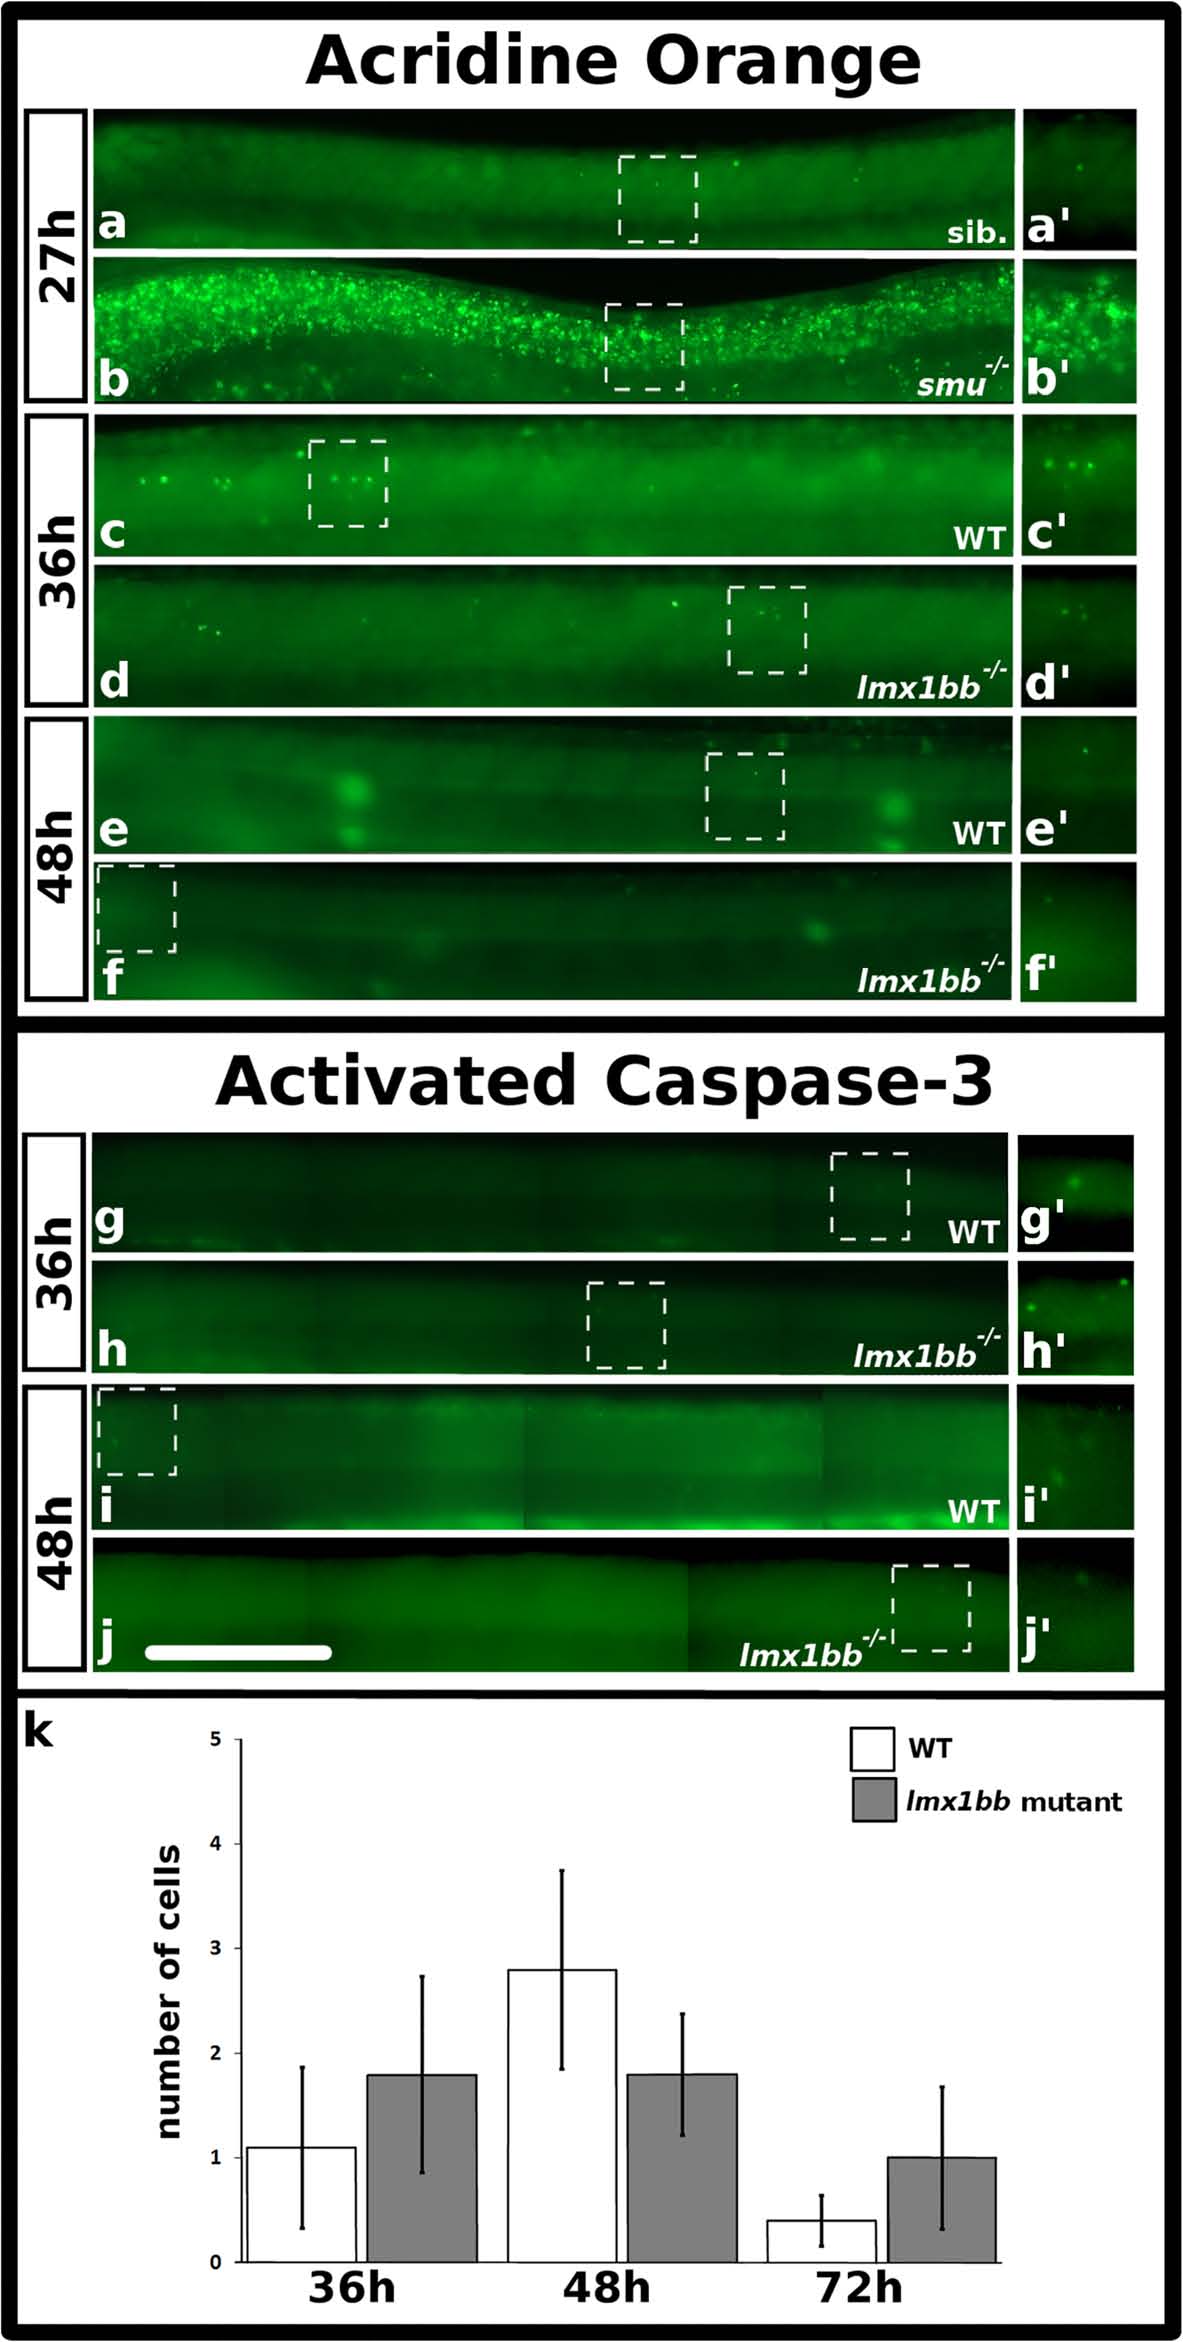
There is no increase in apoptosis in lmx1bb mutants between 36 h and 72 h. Lateral view of zebrafish spinal cord at 27 h (a-b′), 36 h (c-d′ and g-h′) and 48 h (e-f′ and i-j′), anterior left, dorsal top. Acridine orange (AO) treatment (a-f′) and activated caspase-3 immunohistochemistry as anterior-posterior montages (g-j′). Sib. in (a) is a sibling embryo to smoothened mutant in (b). (a′-j′) are magnified view of corresponding boxed region. Mean number of cells (y-axis) with activated caspase-3 staining in WT embryos (white) and lmx1bb homozygous mutants (grey) (x-axis) at indicated developmental times. Error bars indicate standard error of the mean. Two independent experiments were conducted for (c-j). Expression (a-j) and cell count data (k) were similar in each replicate. Data presented in (k) are average values of 5-8 embryos from the same experiment. Precise number of embryos counted and p values are provided in Table 6. Scale bar = 100 µm (a-j) and 80 µm (a′-j′)