
IMAGE
Fig. S2
- ID
- ZDB-IMAGE-160928-19
- Publication
- Sarmah et al., 2016 - Embryonic Ethanol Exposure Dysregulates BMP and Notch Signaling, Leading to Persistent Atrio-Ventricular Valve Defects in Zebrafish
- All Figures
- Figures for Sarmah et al., 2016
Image
|
Figure Caption
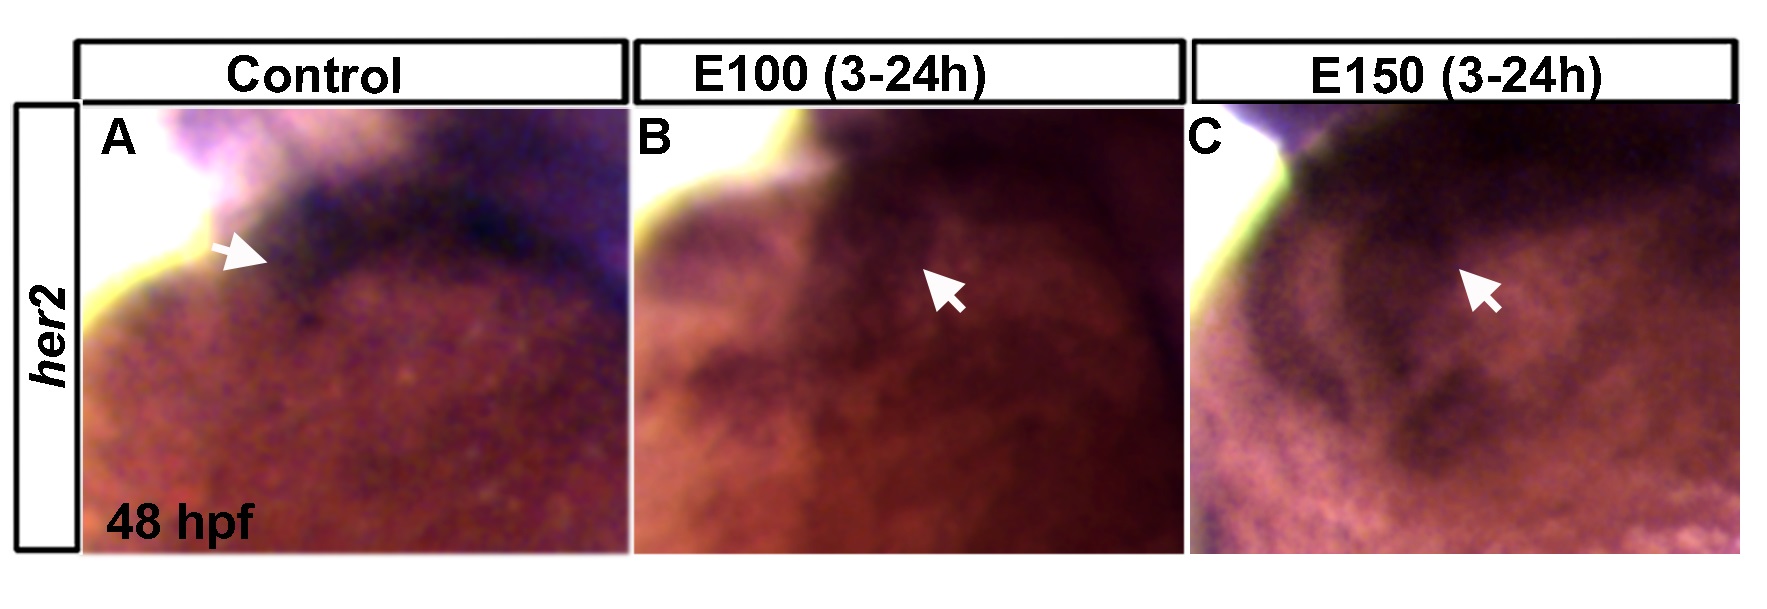
Fig. S2
Expression of her2 in the heart.
(A-C) her2 expression in the control heart (A); her2 expression in ethanol treated embryo hearts (B, C). Arrow: heart.
Acknowledgments
This image is the copyrighted work of the attributed author or publisher, and
ZFIN has permission only to display this image to its users.
Additional permissions should be obtained from the applicable author or publisher of the image.
Full text @ PLoS One