
Fig. 2
- ID
- ZDB-IMAGE-160927-48
- Genes
- Publication
- Zhao et al., 2016 - Enhanced angiogenesis, hypoxia and neutrophil recruitment during Myc-induced liver tumorigenesis in zebrafish
- All Figures
- Figures for Zhao et al., 2016
|
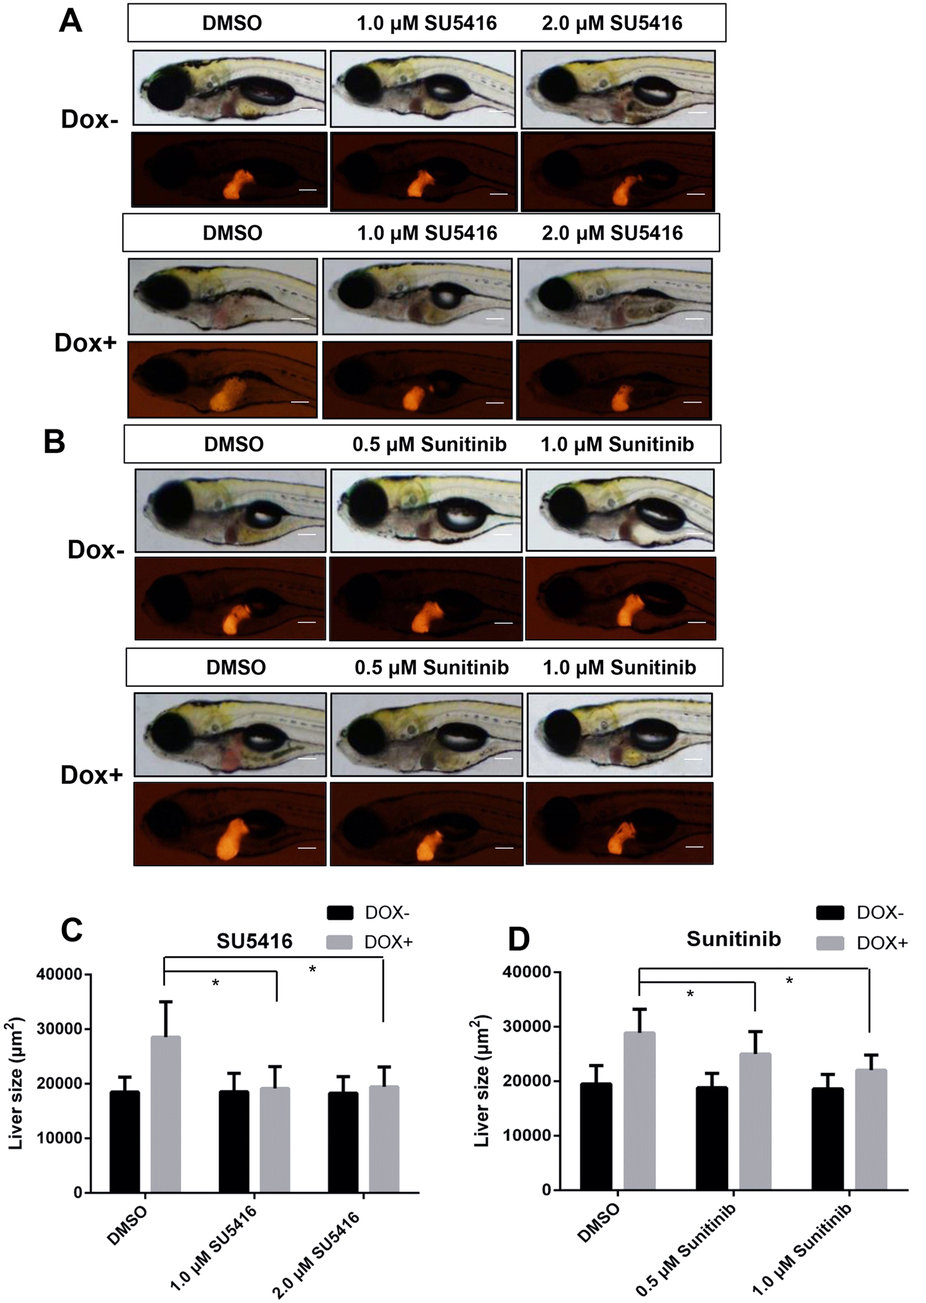
Fig. 2
Effects of angiogenesis inhibitors on tumorigenic liver growth.
To(Myc)/LiPan double transgenic larvae were treated with anti-angiogenesis compounds SU5416 (1 µM or 2 µM) or sunitinib 0.5 µM or 1 µM) with or without 30 µg/ml Dox from 3 dpf to 7 dpf. 0.1% DMSO was used as vehicle control for both compounds. Liver areas were imaged and 2D liver areas were quantified. (A,B) Images of representative 7-dpf double transgenic larvae treated with different concentrations of SU5416 (A) and sunitinib (B). Both bright field (top) and fluorescent images (bottom) are shown. (C,D) Quantification of changes of 2D liver size after treatment with SU5416 (C) and sunitinib (D). The quantitative data were based on 10 samples per concentration group. The original magnification was 10x. Data are represented as mean ± SD. Astrisks indicate significant difference with P-value < 0.05 by two way ANOVA statistical analysis. Scale bars = 100 µm.