
|
Fig. S1
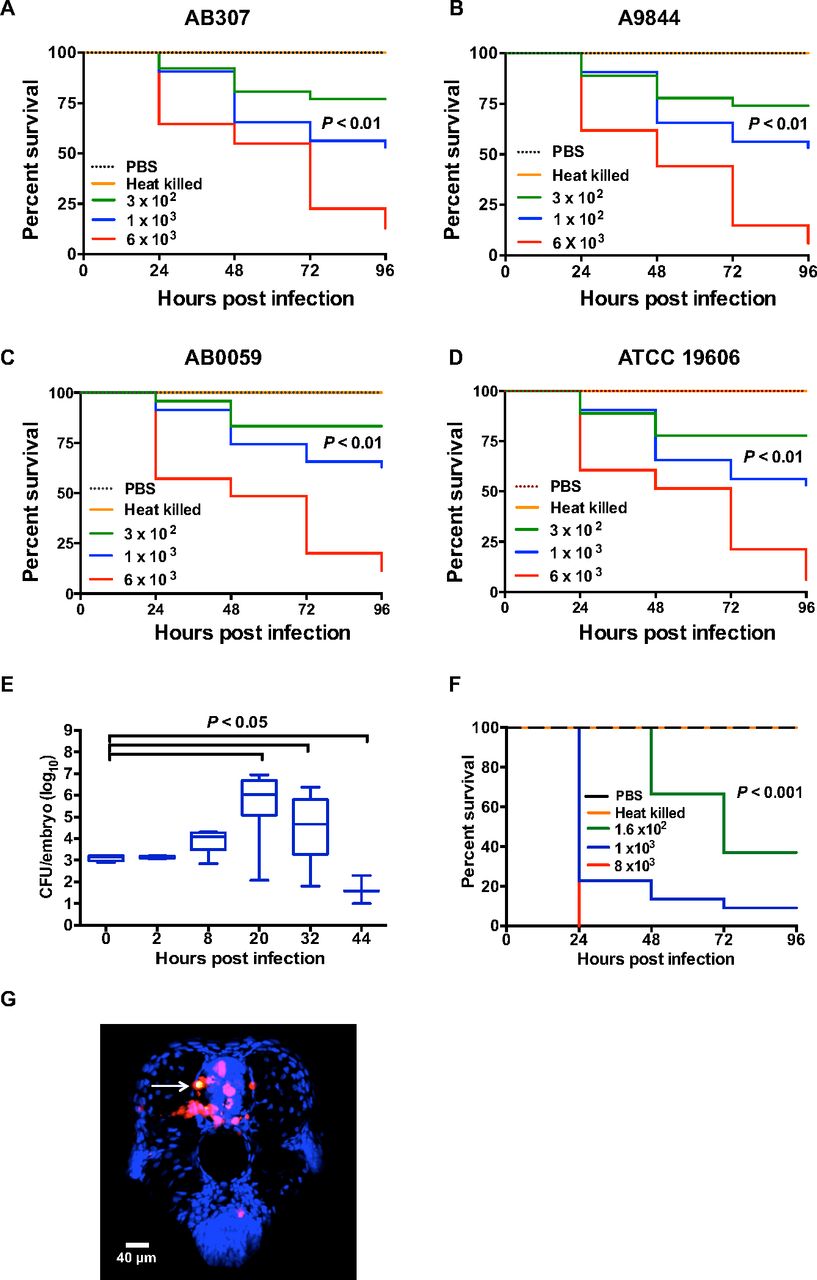
Zebrafish survival after bloodstream infection with clinical A. baumannii strains: (A) AB307, (B) A9844, (C) AB0059, and (D) ATCC 19606 (n = 30 embryos, three biological replicates; P value is a comparison of 3 × 10² and 1 × 10² cfu per embryo by log-rank test). (E) Bacterial density over time in zebrafish. At a lower infection inoculum, zebrafish were able to control and clear infection [median (range) of five homogenized embryos at each time point, pooled data from four biological replicates and compared using unpaired t test with Welch’s correction]. (F) When zebrafish were infected into the yolk sac, hypersusceptibility to lethal infection was observed (n = 30 embryos, three biological replicates; P value is a comparison of 1.6 × 10² and 1 × 10³ cfu per embryo by log-rank test). (G) Histopathological section taken at 2 h through a localized somatic muscle infection with A. baumannii-GFP. Neutrophils are red fluorescent [Tg(lyz:DsRed)nz50] with DAP counterstain (white arrow indicates phagocytosed bacteria). (Scale bar: 40 µm.)