
|
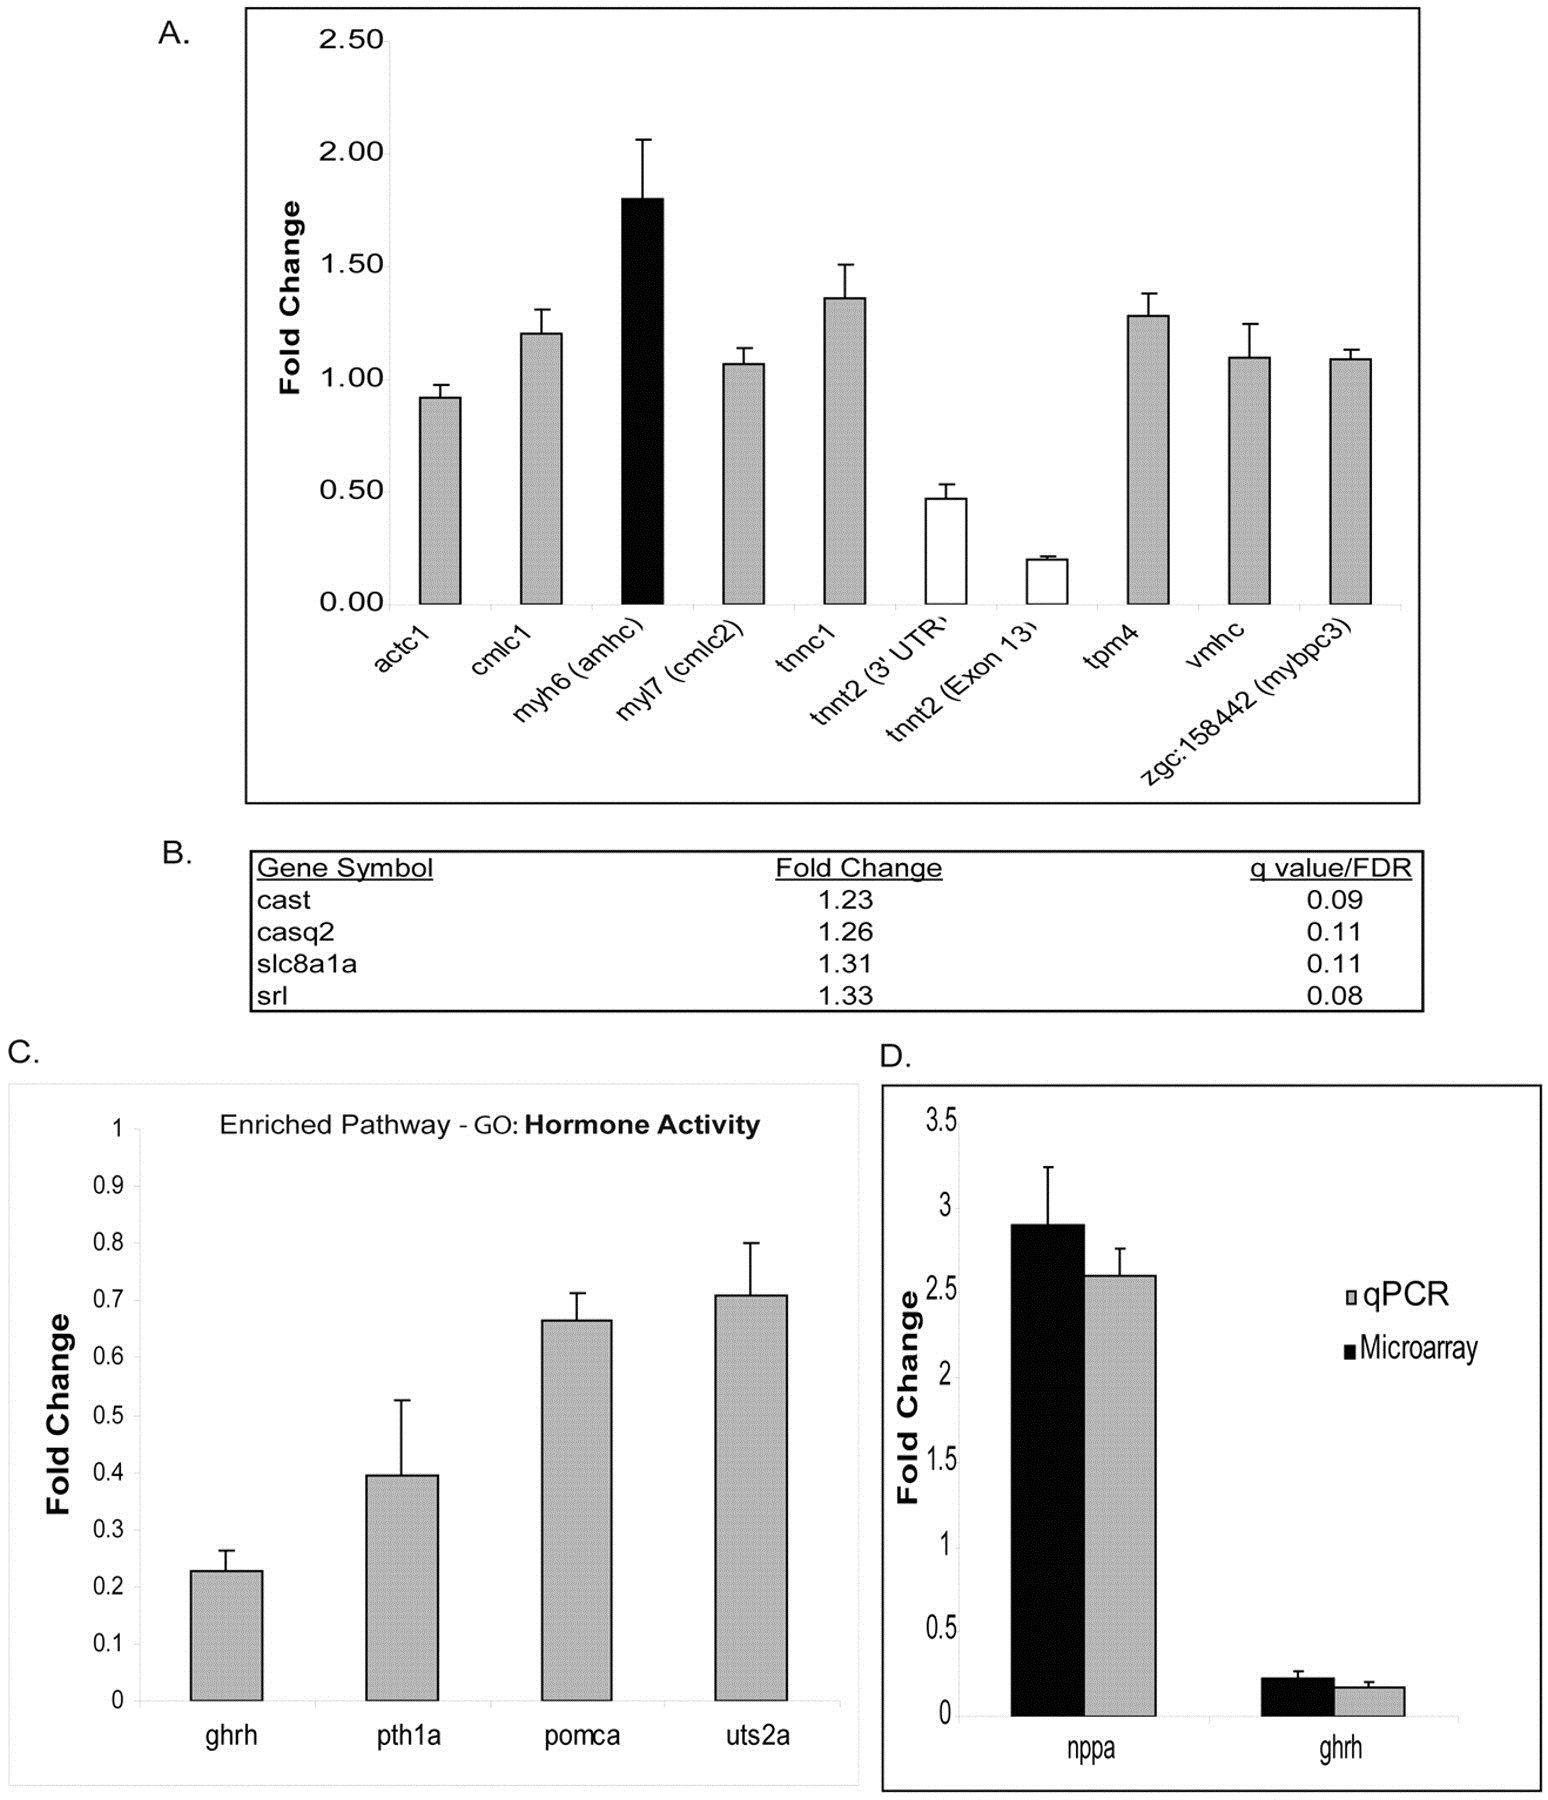
Fig. 5
Altered tnnt2 splicing induces significant changes in the expression of sarcomeric genes, neurohormonal genes and markers of hypertrophy. (A) Expression profiling identifies upregulation of myh6 (black bar) and confirms efficacy of TNNT2sp MO [white bar labeled ′tnnt2 (Exon 13)′. (B) Genes involved in cardiomyocyte Ca2+ handling that are differentially regulated in TNNT2sp morphants. (C) Pathway analysis identifies significant downregulation of expression of genes encoding specific hormones - ghrh, pth1a, pomca and uts2a. (D) qPCR confirmation of select up- and downregulated genes. All data expressed as mean + s.e.m.