
|
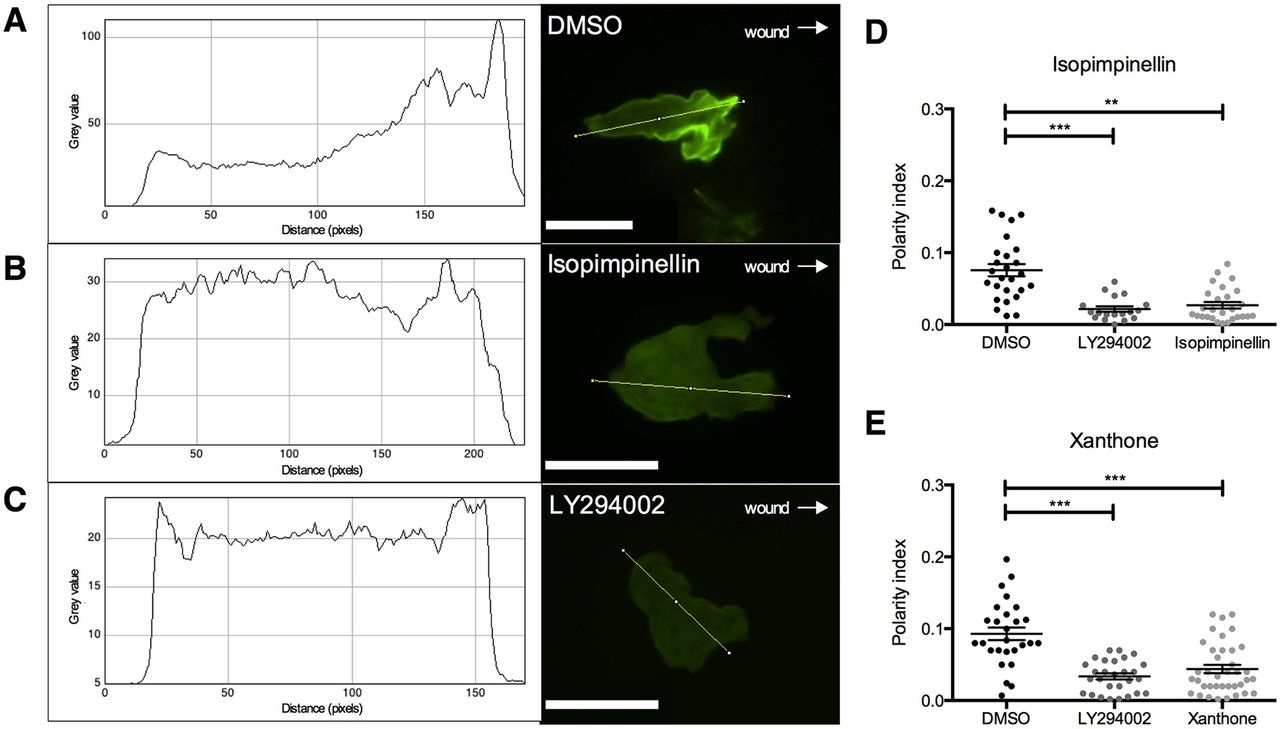
Fig. 2
Isopimpinellin and xanthone inhibit polarisation of neutrophils upstream of PI3K. Assay to measure the polarity index of neutrophils in Tg(lyz:PHAkt-EGFP) larvae pretreated with 25µM isopimpinellin, 25µM xanthone, 50µM LY294002 or DMSO as a vehicle control for 2h prior to tail-fin injury. Representative images of individual neutrophils in the region between the wound site and posterior blood island illustrate polarisation and a defined leading edge of a migrating neutrophil in (A) DMSO control-treated larvae, compared to (B) isopimpinellin- and (C) LY294002-treated larvae, which do not polarise or have a defined leading edge (scale bars: 11µm). Arrows indicate direction of wound. Fluorescence (referred to as grey value) was measured in a transection of each neutrophil (the yellow lines drawn through the cells) to generate intensity profiles shown in the panels on the left and quantify neutrophil polarity index as previously described (Wang et al., 2014). Both (D) isopimpinellin and (E) xanthone reduced the neutrophil polarity index to a similar level as the known PI3K inhibitor LY294002 (one-way ANOVA with Dunnett′s multiple-comparison post-test; **P<0.01, ***P<0.001; n=27, performed as three independent experiments).