
Fig. S4
- ID
- ZDB-IMAGE-160901-8
- Publication
- Casano et al., 2016 - Developmental Apoptosis Mediates Entry and Positioning of Microglia in the Zebrafish Brain
- All Figures
- Figures for Casano et al., 2016
|
Fig. S4
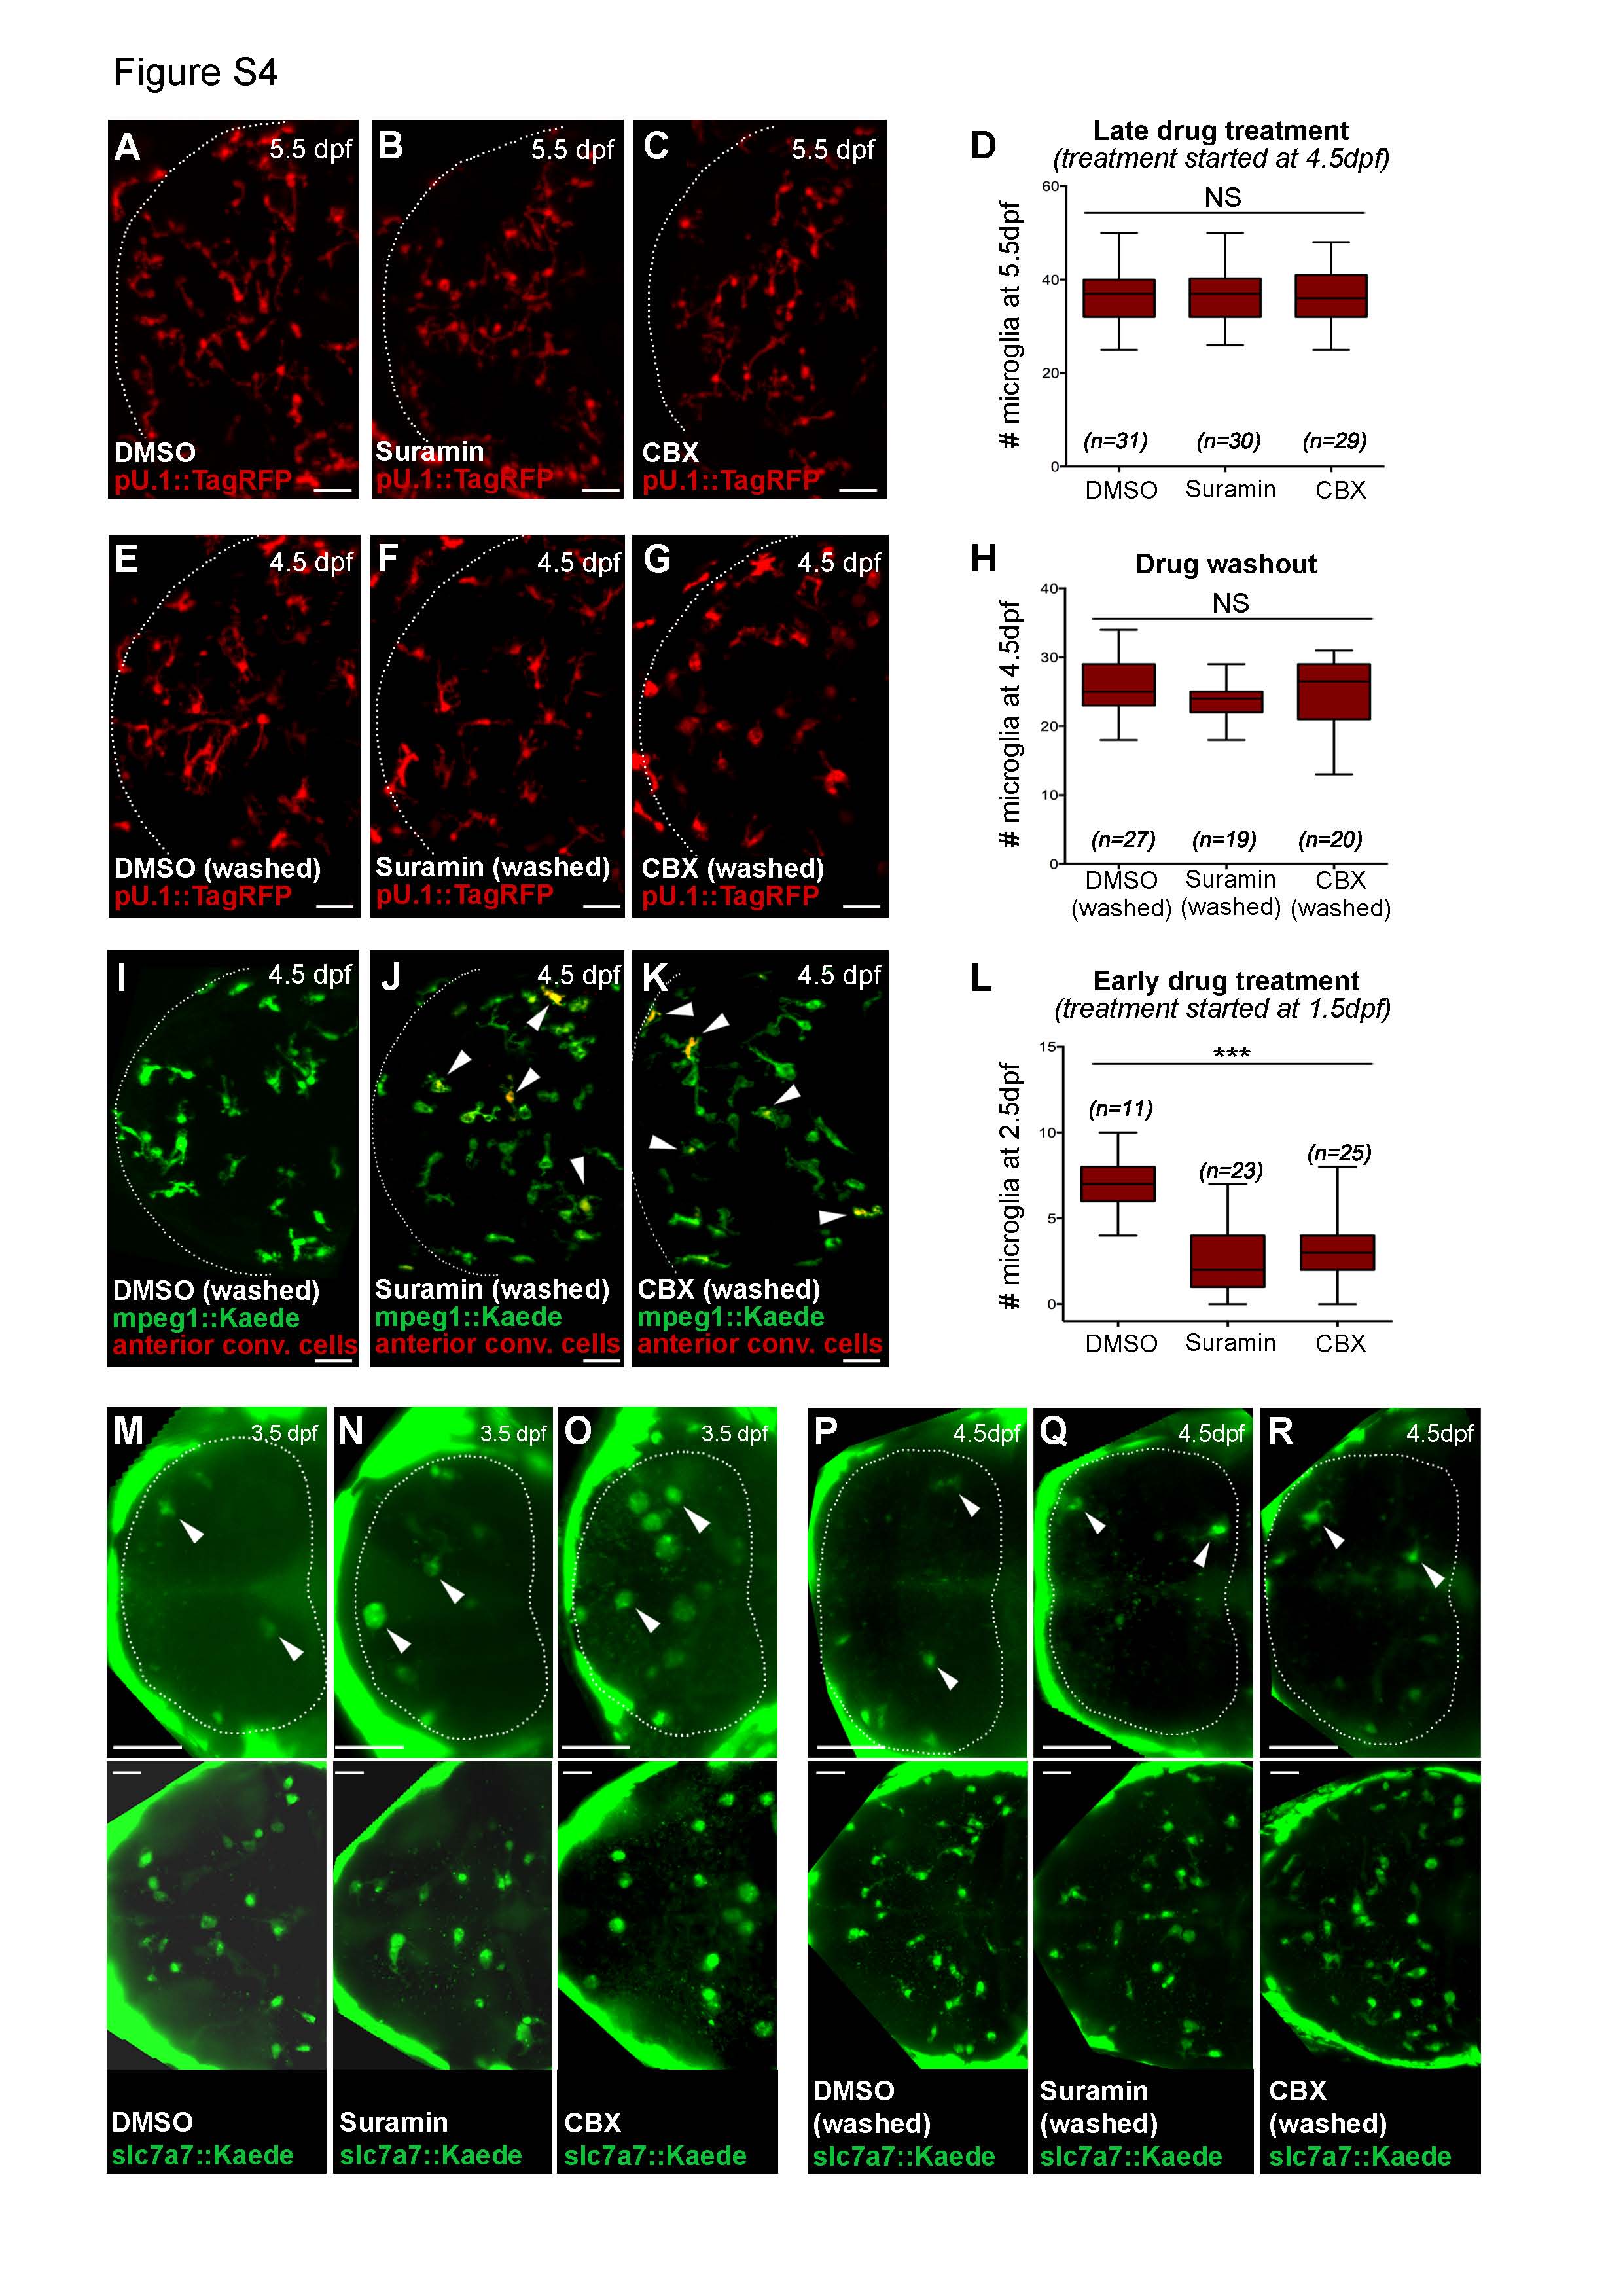
Inhibition of nucleotide signaling impairs microglial precursors invasion in response to cell death. Related to Figure 4.
(A-D) Distribution (A-C) and quantification (D) of microglia in pU.1::GAL4-UAS::TagRFP embryos at 5.5dpf, 24h after DMSO, suramin and CBX treatment. Data from 2 independent experiments.
(E-H) Microglial distribution (E-G) and quantification (H) in the optic tectum of pU.1::GAL4- UAS::TagRFP embryos at 4.5dpf, 24 hours after drug washout. Data from 3 independent experiments.
(I-K) Dorsal view of mpeg1::GAL4-UAS::Kaede embryo showing invasion of macrophages after restoring nucleotide signaling. 24-hours after photoconversion and drug washout, macrophages that were present anteriorly are found inside the brain (red/yellow cells, white arrowheads).
(L) Microglial distribution in the optic tectum of pU.1::GAL4-UAS::TagRFP embryos at 2.5dpf, 24h after DMSO, suramin and CBX treatment. Data from 2 independent experiments.
(M-R) Distribution of microglial precursors in the anterior head region (upper panels) and optic tectum (lower panels) of the same slc7a7::Kaede embryos, 24h after drug treatment (M-O) or drug washout
(P-R). White arrowheads indicate slc7a7+ cells. Dotted lines delimit the anterior region of the head. Scale bar, 30µm. n, number of analyzed embryos. NS, non significant. *** p < 0.001.