
Fig. S4
- ID
- ZDB-IMAGE-160830-19
- Publication
- Antinucci et al., 2016 - Neural Mechanisms Generating Orientation Selectivity in the Retina
- All Figures
- Figures for Antinucci et al., 2016
|
Fig. S4
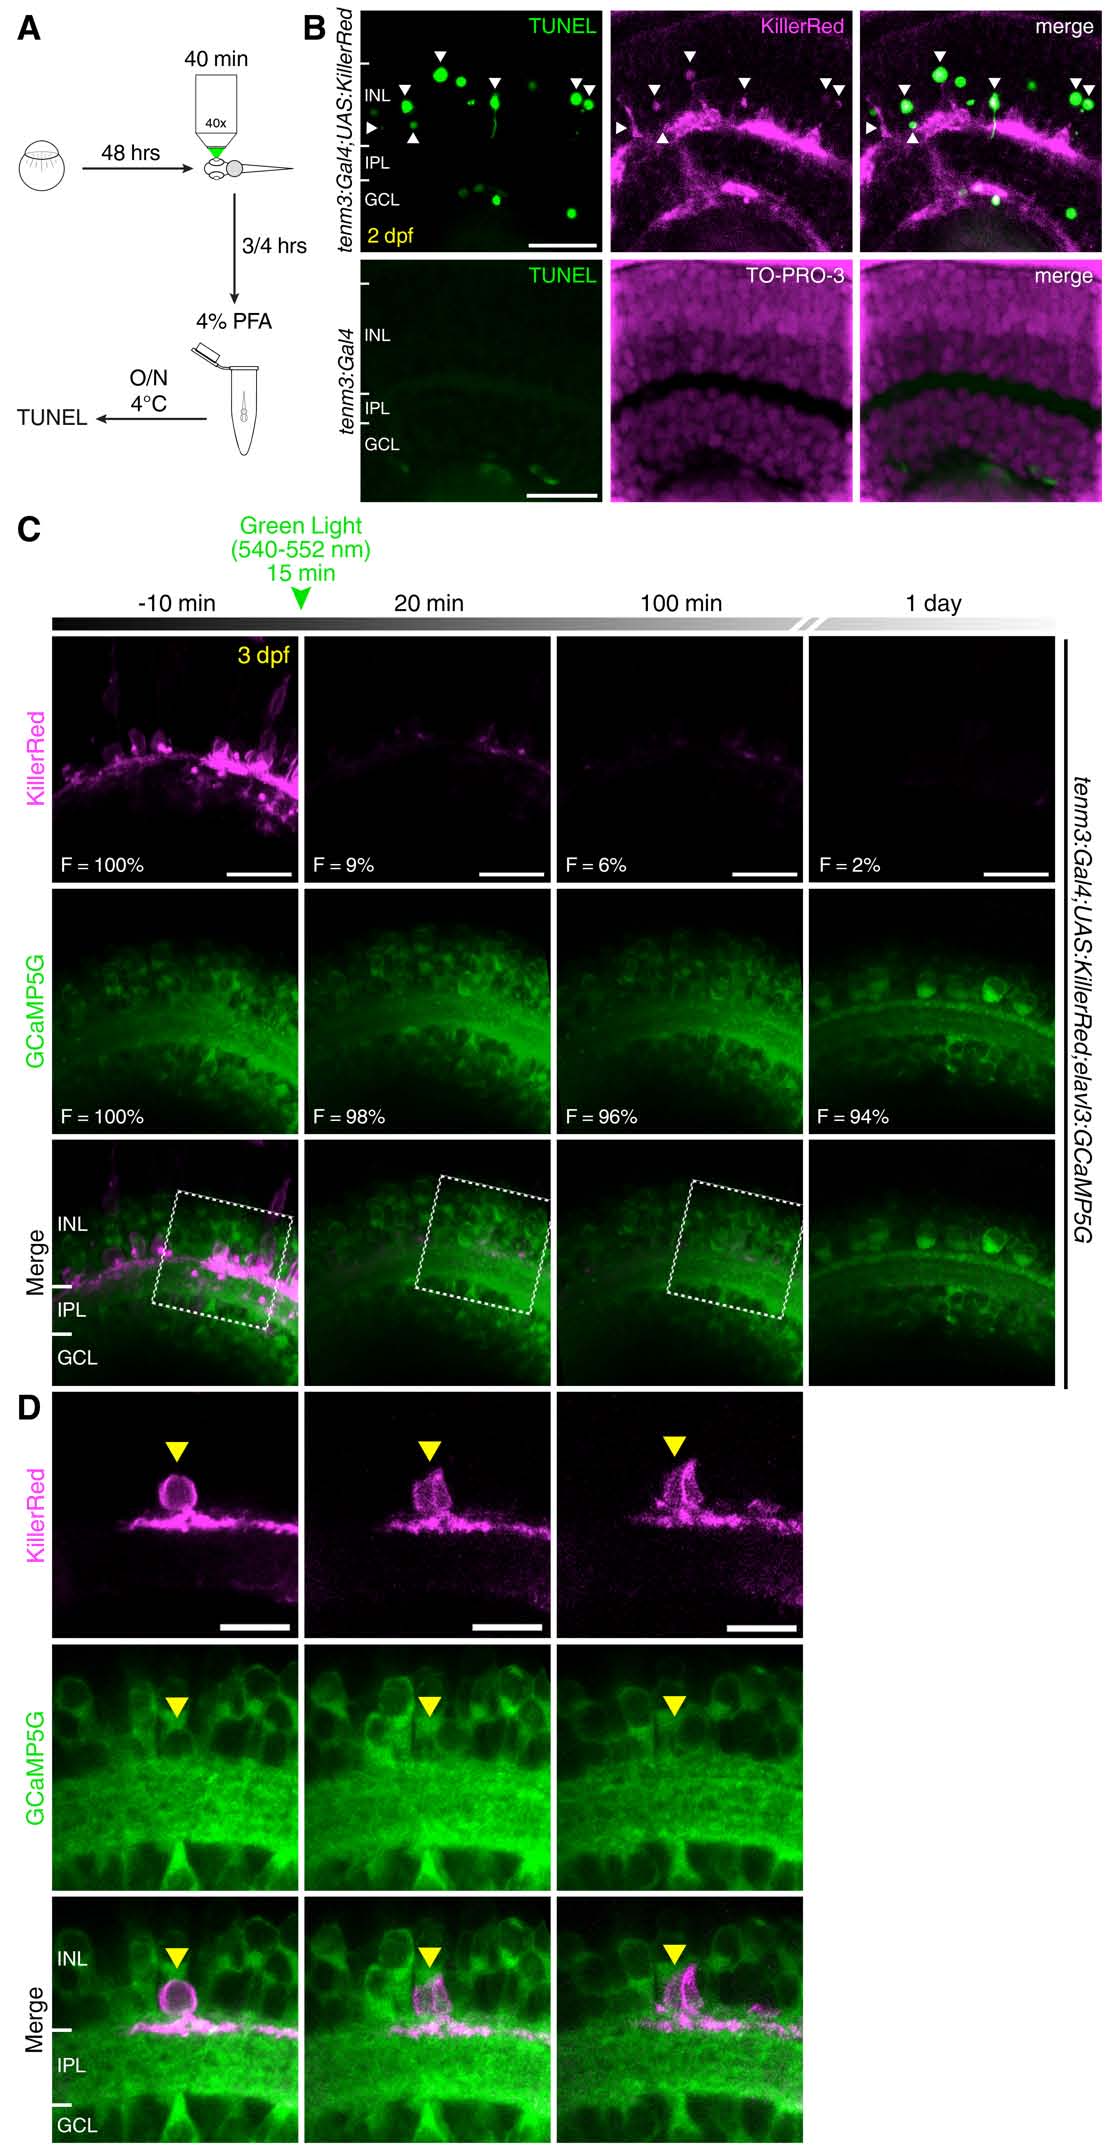
Optogenetic Ablation of Tenm3+ ACs using KillerRed, Related to Figure 3 and Movie S3. (A) Schematic summarising the experimental procedure used to validate the optogenetic ablation of tenm3+ ACs. At 2 dpf, the eyes of Tg(tenm3:Gal4;UAS:KillerRed) and Tg(tenm3:Gal4) control larvae were illuminated with intense green light (540-552 nm) for 40 minutes using a wide-field fluorescence microscope equipped with a 40× objective. After 3-4 hours, the larvae were fixed in 4% paraformaldehyde (PFA) at 4°C overnight (O/N). Subsequently, larvae were cryosectioned and fluorometric terminal deoxynucleotidyl transferase dUTP nick end labeling (TUNEL) assays were performed on sections following standard protocols. (B) TUNEL staining (green) shows the presence of apoptotic nuclei characteristic of dying cells in the retinae of 2-dpf Tg(tenm3:Gal4;UAS:KillerRed) larvae following 40 minutes of green light illumination (top, n = 3 larvae). In these larvae KillerRed (magenta) is selectively expressed in tenm3+ ACs. White arrowheads indicate the sites of co-localisation between KillerRed+ cell bodies and TUNEL+ apoptotic nuclei in the inner nuclear layer (INL). Importantly, no cell death is detected in the retinae of 2-dpf Tg(tenm3:Gal4) control larvae that were subjected the same illumination procedure (bottom, n = 3 larvae). In the bottom panel, cell bodies are labelled with the nuclear stain TO-PRO-3 (magenta). GCL, ganglion cell layer; IPL, inner plexiform layer. Scale bars are 20 µm. (C) Proof-of-principle experiment showing the effects of 15 minutes illumination with green light on the KillerRed (magenta) fluorescence level (F) in the retina of a 3-dpf Tg(tenm3:Gal4; UAS:KillerRed;elavl3:GCaMP5G) larva. Strikingly, strong photobleaching (~90% decrease in fluorescence) is observed after green light illumination, indicating effective KillerRed phototoxicity. This large decrease in KillerRed fluorescence is visible even one day after illumination. No significant decrease in the overall GCaMP5G fluorescence (green) is detected after illumination. Importantly, all images were obtained using the same acquisition settings. Scale bars are 20 µm. (D) Inset of (C) showing the dramatic morphological changes of a single KillerRed-expressing tenm3+ AC (yellow arrowhead) following green light illumination. Notably, also the GCaMP5G fluorescence appears to decrease in this cell, probably due to the production of phototoxic reactive oxygen species in the cytoplasm. The magenta channel signal has been increased post-acquisition to compensate for the ~90% decrease in fluorescence resulting from the illumination procedure. Scale bars are 10 µm.