
|
Fig. 2
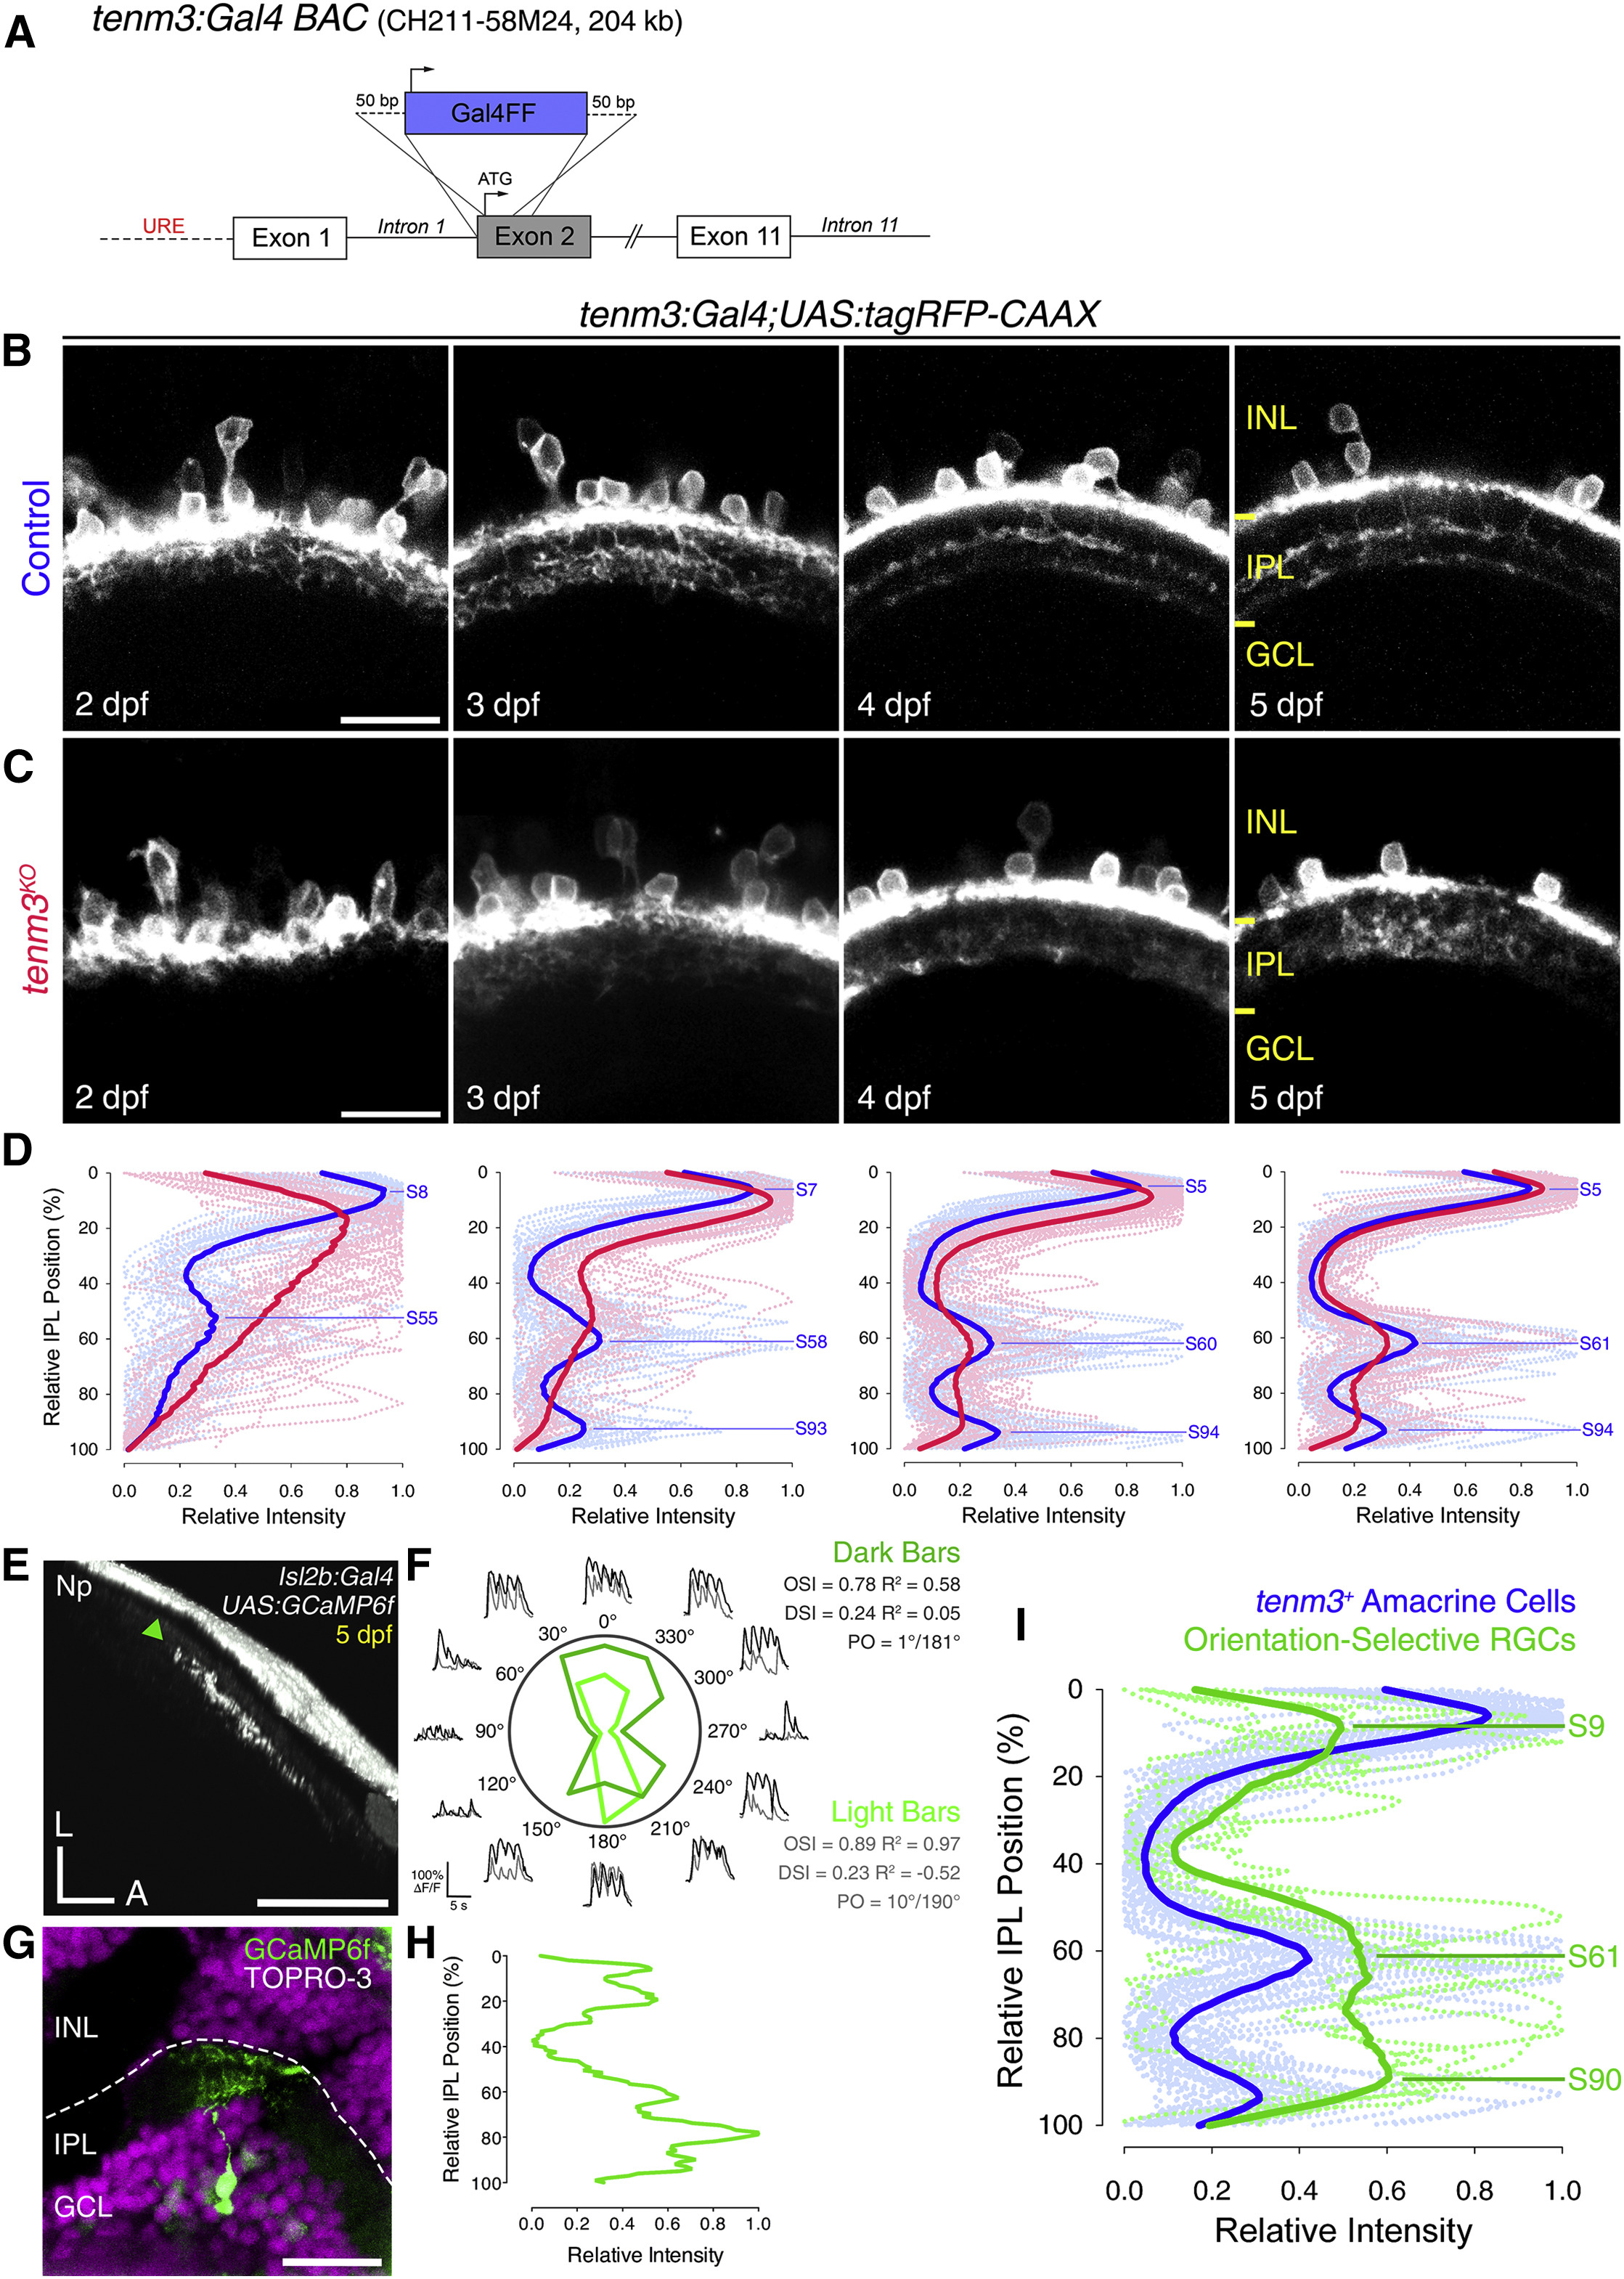
IPL Stratification Pattern of Tenm3+ ACs and OSGCs
(A) Schematic of the bacterial artificial chromosome (BAC) DNA construct used to transgenically express Gal4FF in tenm3+ cells. URE, upstream regulatory elements.
(B and C) Inner plexiform layer (IPL) stratification pattern of tenm3+ AC neurites in control (B) and tenm3KO (C) Tg(tenm3:Gal4;UAS:tagRFP-CAAX) larvae from 2 to 5 dpf. INL, inner nuclear layer; GCL, ganglion cell layer. Scale bars, 20 µm.
(D) IPL fluorescence intensity profiles of tenm3+ AC neurites in control (blue; n = 13 larvae) and tenm3KO larvae (red; n = 13 larvae) from 2 to 5 dpf. Thin traces represent individual IPL profiles, whereas thick traces indicate average IPL profiles. 0% corresponds to the INL/IPL boundary, whereas 100% corresponds to the IPL/GCL boundary. Fluorescence peaks indicating IPL strata in control larvae are labeled with the letter “S” followed by their relative IPL position.
(E and F) Visual responses to moving bars (F) recorded through calcium imaging of an individual orientation-selective RGC (OSGC) axon terminal expressing GCaMP6f (E, green arrowhead) in the optic tectum of a 5-dpf UAS:GCaMP6f-injected Tg(isl2b:Gal4) larva. Polar plots show the integral responses to moving dark and light bars (F; dark and light green, respectively). Black and gray traces represent the ΔF/F0 calcium responses to moving dark and light bars, respectively. Np, neuropil; L, lateral; A, anterior; PO, preferred orientation. Scale bar, 40 µm.
(G and H) Immunostaining for GCaMP6f (green) showing the dendritic morphology (G) of the functionally identified OSGC in (E) and the corresponding normalized IPL fluorescence intensity profile (H). Cell bodies are labeled with the nuclear stain TO-PRO-3 (magenta). Scale bar, 20 µm.
(I) IPL fluorescence intensity profiles of OSGCs (green; n = 5 cells) and tenm3+ AC neurites (blue; n = 13 larvae) at 5 dpf. 12.8% of functionally imaged RGCs were OS (five out of 39 cells in 39 larvae). Thin traces represent individual IPL profiles, whereas thick traces indicate average IPL profiles. Fluorescence peaks indicating IPL strata formed by OSGC dendrites are labeled with the letter “S” followed by their relative IPL position.
See also Figures S2 and S3 and Movie S2.