
Fig. 6
- ID
- ZDB-IMAGE-160823-27
- Publication
- Vihtelic et al., 2005 - Lens opacity and photoreceptor degeneration in the zebrafish lens opaque mutant
- All Figures
- Figures for Vihtelic et al., 2005
|
Fig. 6
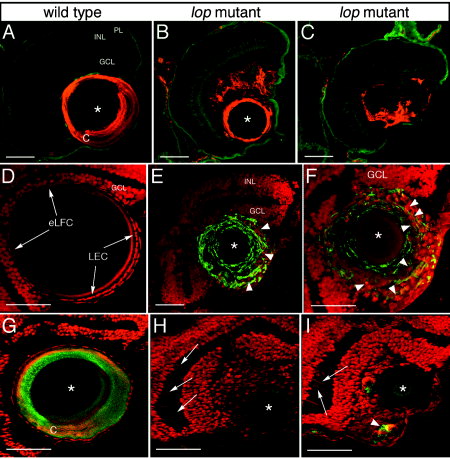
zl-1 and actin expression in the lop lens and retina. A-F: The lens structure is highlighted by immunodetection of the zl-1 antigen. A-C: The zl-1 spatial distribution in the 7 days postfertilization wild-type lens is shown in A, whereas two different mutant lenses are shown in B and C. E,F: The zl-1-labeled (arrowheads) mutant section (F is at higher magnification) was also stained with propidium iodide to visualize the lens and retinal nuclei. D: For comparison, a wild-type propidium iodide-stained lens is shown. The lens epithelial cells (LEC) and elongating fiber cells (eLFC) are visualized (arrows). G-I: Propidium iodide-stained frozen sections whose actin was labeled using phalloidin-AlexaFluor 488 (green). G: Strong actin staining is localized to the lens cortex of the wild-type lens. H,I: The two different mutants demonstrate reduced actin expression in the lens, aberrant actin localization (I, arrowhead) and fusiform-shaped nuclei within the inner retinal layers (H,I, arrows). Asterisks denote the central lens nuclear regions. PL, photoreceptor layer; INL, inner nuclear layer; GCL, ganglion cell layer; eLFC, elongating fiber cells; LEC, lens epithelial cells; C, lens cortex. Scale bars = 50 µm in A-I.