
Fig. 4
- ID
- ZDB-IMAGE-160819-34
- Publication
- Rochard et al., 2016 - Roles of Wnt pathway genes wls, wnt9a, wnt5b, frzb and gpc4 in regulating convergent-extension during zebrafish palate morphogenesis
- All Figures
- Figures for Rochard et al., 2016
|
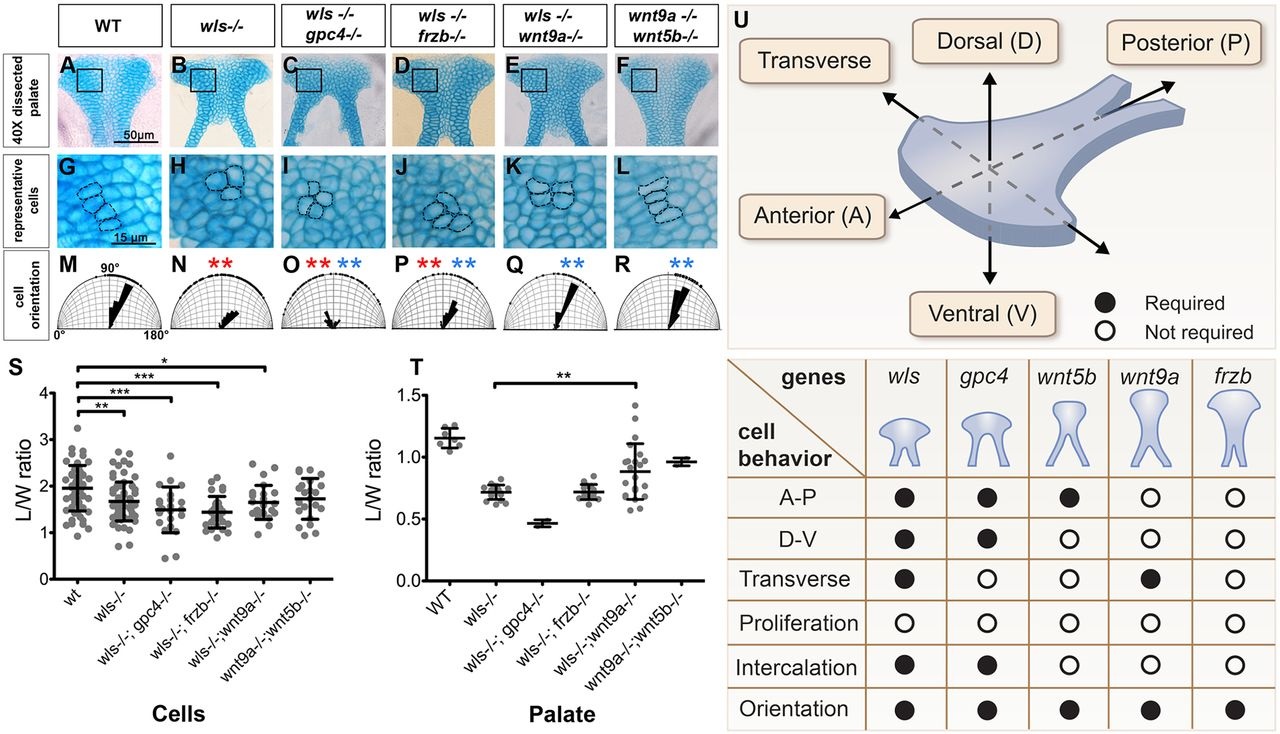
Fig. 4
Genetic interactions between wls, gpc4, wnt9a, wnt5b and frzb regulate palate morphogenesis. (A-L) Anterior is up. Dissected palates (A-F) and magnified views (G-L) showing cell size, organization and orientation. (M-R) Cell orientation was measured and compared with WT (significantly different indicated by red asterisk) and with wls mutant (significantly different indicated by blue asterisk). (S,T) Length, width and length/width ratio measured in cells (S) and palate (T). *P<0.05, **P<0.01, ***P<0.0001. (U) Summary of relative contributions of each gene to palate morphogenesis. The principal axes of the palate are diagramed and the chart beneath summarizes the morphogenetic processes involved in palate development.