
|
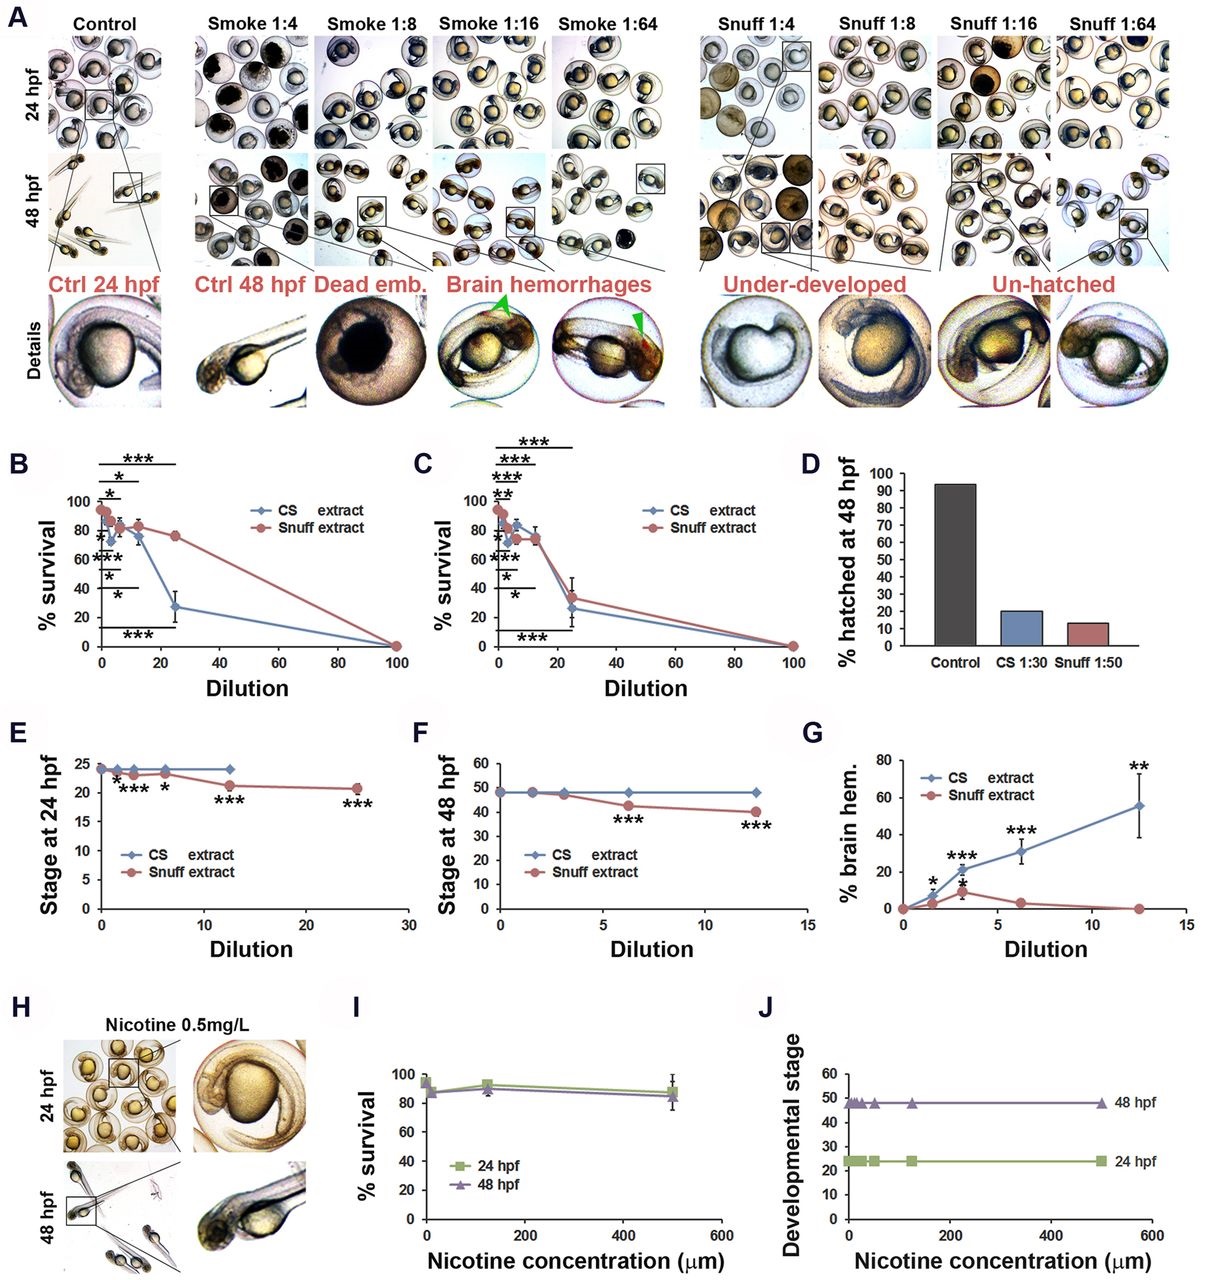
Fig. 1
Developmental toxicities of cigarette smoke and snuff extracts. (A) Bright-field micrographs of zebrafish embryos at 24 or 48hours post-fertilization (hfp) treated with nothing (control) or various concentrations of cigarette smoke (CS) or snuff extracts. Areas indicated by black boxes in the upper two rows are enlarged in the third row. Brain hemorrhages are highlighted by green arrowheads. (B) Quantification of the proportion of CS or snuff extract-treated embryos that survived to the 24hpf stage. n=40 for the undiluted CS and snuff groups, 120 for control groups and 80 embryos for all other groups. CS: P<5.1×10⁻¹¹, snuff: P<9.6×10⁻¹⁰ by single-factor ANOVA. *P<0.05, ***P<0.001 comparing each concentration of tobacco extract to its own control. (C) Quantification of the proportion of CS or snuff extract-treated embryos that survived to the 48hpf stage. n=40 for the undiluted CS and Snuff groups, 120 for control groups and 80 embryos for all other groups. CS: P<7.7×10⁻⁹, snuff: P<4.1×10⁻⁹ by single-factor ANOVA. *P<0.05, ***P<0.001 comparing each concentration of tobacco extract to its own control. (D) Quantification of the proportion of non-treated, CS extract-treated or snuff extract-treated embryos hatched at the 72hpf stage. n=15 embryos. (E) Average stage translated to time-after-fertilization of embryos treated with CS or snuff extracts evaluated 24hpf. n=36 embryos for control (0), 38, 36, 34, 30 and 29, or 35, 30, 36 and 34 embryos for increasing concentrations of snuff or CS, respectively. CS: P>0.05, snuff: P<7.5×10⁻⁷ by single-factor ANOVA. *P<0.05, ***P<0.001. (F) Average stage translated to time-after-fertilization of embryos treated with CS or snuff extracts evaluated 48hpf. n=36 embryos for control (0), 37, 32, 29 and 28, or 35, 30, 36 and 34 embryos for increasing concentrations of snuff or CS, respectively. CS: P>0.05, snuff: P<3.2×10⁻²⁵ by single-factor ANOVA. ***P<0.001. (G) Quantification of the proportion of CS extract-treated or snuff extract-treated embryos exhibiting obvious bleedings in the brain (brain hem.) at 48hpf. n=80 embryos. SC: P<0.018, snuff: P<6.3×10⁻⁴ by single-factor ANOVA. *P<0.05, **P<0.01, ***P<0.001. (H) Bright-field micrographs of zebrafish embryos at 24 or 48hpf treated with 0.5mg/l nicotine. Areas indicated by black boxes in left column are enlarged in the right column. (I) Quantification of the proportion of nicotine-treated embryos that survived to the 24 or 48hpf stages. n=120 embryos for control (0) and 80, 40 or 40 for increasing concentrations of nicotine. P<0.015 by single-factor ANOVA. (J) Average stage translated to time-after-fertilization of embryos treated with nicotine evaluated 24 or 48hpf. n=36 embryos for control (0) and 35, 34, 34, 32, 32, 37 and 35, or 35, 34, 31, 32, 31, 36 and 34 embryos at 24hpf or 48hpf, respectively. P>0.05 by single-factor ANOVA. All experiments were repeated twice with similar results. Results are shown as means±s.e.m. and statistical evaluation as indicated by asterisks was done using Student’s two-tailed t-test assuming equal variance between the groups.