
|
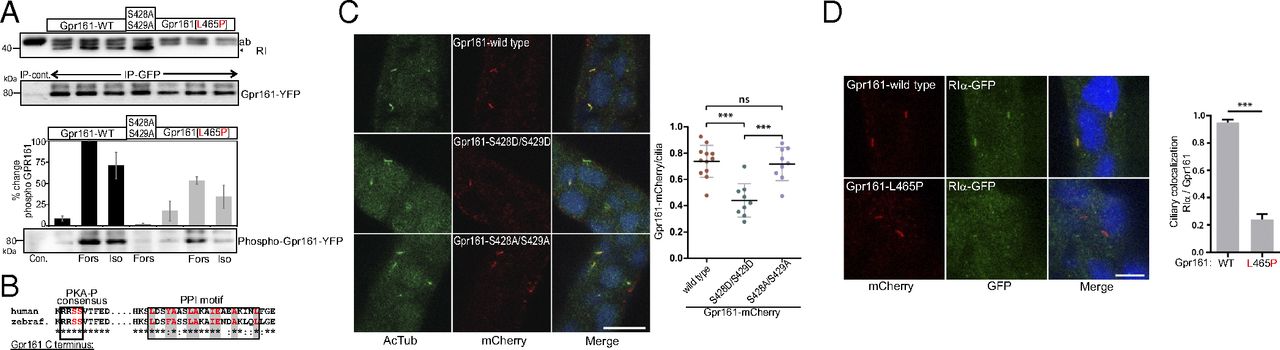
Fig. 4
Phosphorylation and ciliary localization of Gpr161:RIα complexes. (A) IP of Venus-YFP-tagged Gpr161 variants expressed in HEK293 cells following treatments with Forskolin (20 µM, 10 min) and isoproterenol (1 µM, 10 min). Densitometric quantification of n = 4 independent experiments, ±SEM; phospho-(K/R)(K/R)X(S*/T*) specific antibody. The IB with the RI antibody is taken from a different experiment (better separation of antibody and RI). (B) Sequence comparison of AKAP and phosphorylation motifs from human and zebrafish Gpr161-CT. (C) Subcellular localization of indicated Gpr161-mCherry variants and acetylated-Tubulin in zebrafish. (Scale bar, 10 µm.) The graph shows the ratio of Gpr161-positive cilia and the total number of cilia in a minimum of three sections from three independent experiments. P values were calculated using one-way ANOVA and Tukey′s multiple-comparison post hoc test (***P < 0.001). Shown are the individual ratios (±SD) of Gpr161-mCherry wild-type (12 sections, 578 cilia), Gpr161-mCherry S428D/S429D (9 sections, 584 cilia), and Gpr161-mCherry S428A/S429A (9 sections, 415 cilia). (D) Coexpression of Gpr161-mCherry and RIα-GFP in zebrafish. The graph shows the ratio of RIα, Gpr161 double-positive cilia over the total number of Gpr161-mCherry-positive cilia (mean ± SEM, Gpr161-mCherry wild-type n = 7 embryos, Gpr161-mCherry L465P n = 6 embryos). ***P < 0.001 using two-tailed unpaired Student’s t test. (Scale bar, 5 µm.)