
IMAGE
Fig. 2
- ID
- ZDB-IMAGE-160812-15
- Publication
- Solomon et al., 2002 - Concerted action of two dlx paralogs in sensory placode formation
- All Figures
- Figures for Solomon et al., 2002
Image
|
Figure Caption
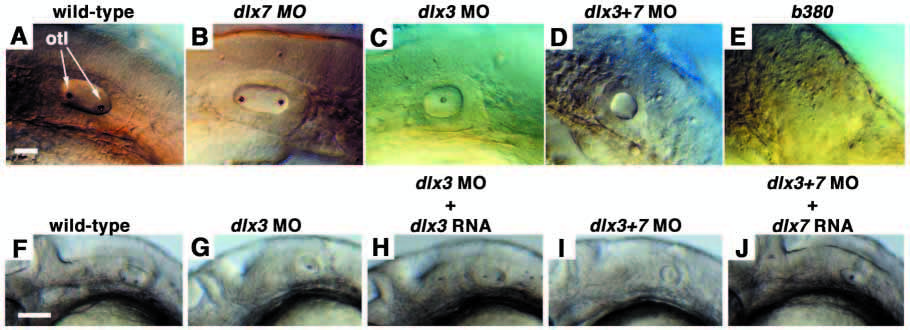
Fig. 2
Loss of dlx3 and dlx7 function leads to a reduction in otic vesicle size. Lateral views, anterior towards the left, of otic vesicles in (A-E) 24 hour and (F-J) 27 hour embryos. (A,F) Wild-type, (B) dlx7 MO, (C,G) dlx3 MO, (D,I) dlx3+7 MO, (E) b380 mutant, (H) dlx3 MO + dlx3 RNA and (J) dlx3+7 MO + dlx7 RNA embryos. otl, otolith. Scale bars: in A, 25 µm for A-G; in F, 75 µm for F-J.
Figure Data
Acknowledgments
This image is the copyrighted work of the attributed author or publisher, and
ZFIN has permission only to display this image to its users.
Additional permissions should be obtained from the applicable author or publisher of the image.
Full text @ Development