
IMAGE
Fig. 8
- ID
- ZDB-IMAGE-160812-13
- Publication
- Kelsh et al., 2000 - Genetic analysis of melanophore development in zebrafish embryos
- All Figures
- Figures for Kelsh et al., 2000
Image
|
Figure Caption
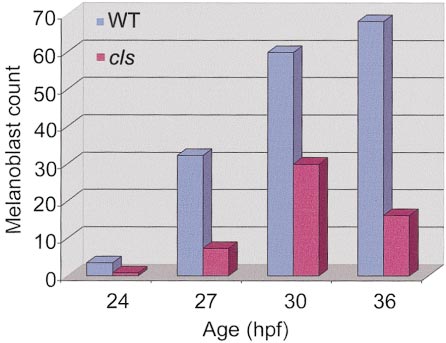
Fig. 8
dct-positive melanoblast numbers in tail of cls- embryos. Total numbers of labelled cells in postanal region of embryos analysed for dct expression are presented. Sample size (n) given at top of column.
Figure Data
Acknowledgments
This image is the copyrighted work of the attributed author or publisher, and
ZFIN has permission only to display this image to its users.
Additional permissions should be obtained from the applicable author or publisher of the image.
Reprinted from Developmental Biology, 225(2), Kelsh, R.N., Schmid, B., and Eisen, J.S., Genetic analysis of melanophore development in zebrafish embryos, 277-293, Copyright (2000) with permission from Elsevier. Full text @ Dev. Biol.