
Image
|
Figure Caption
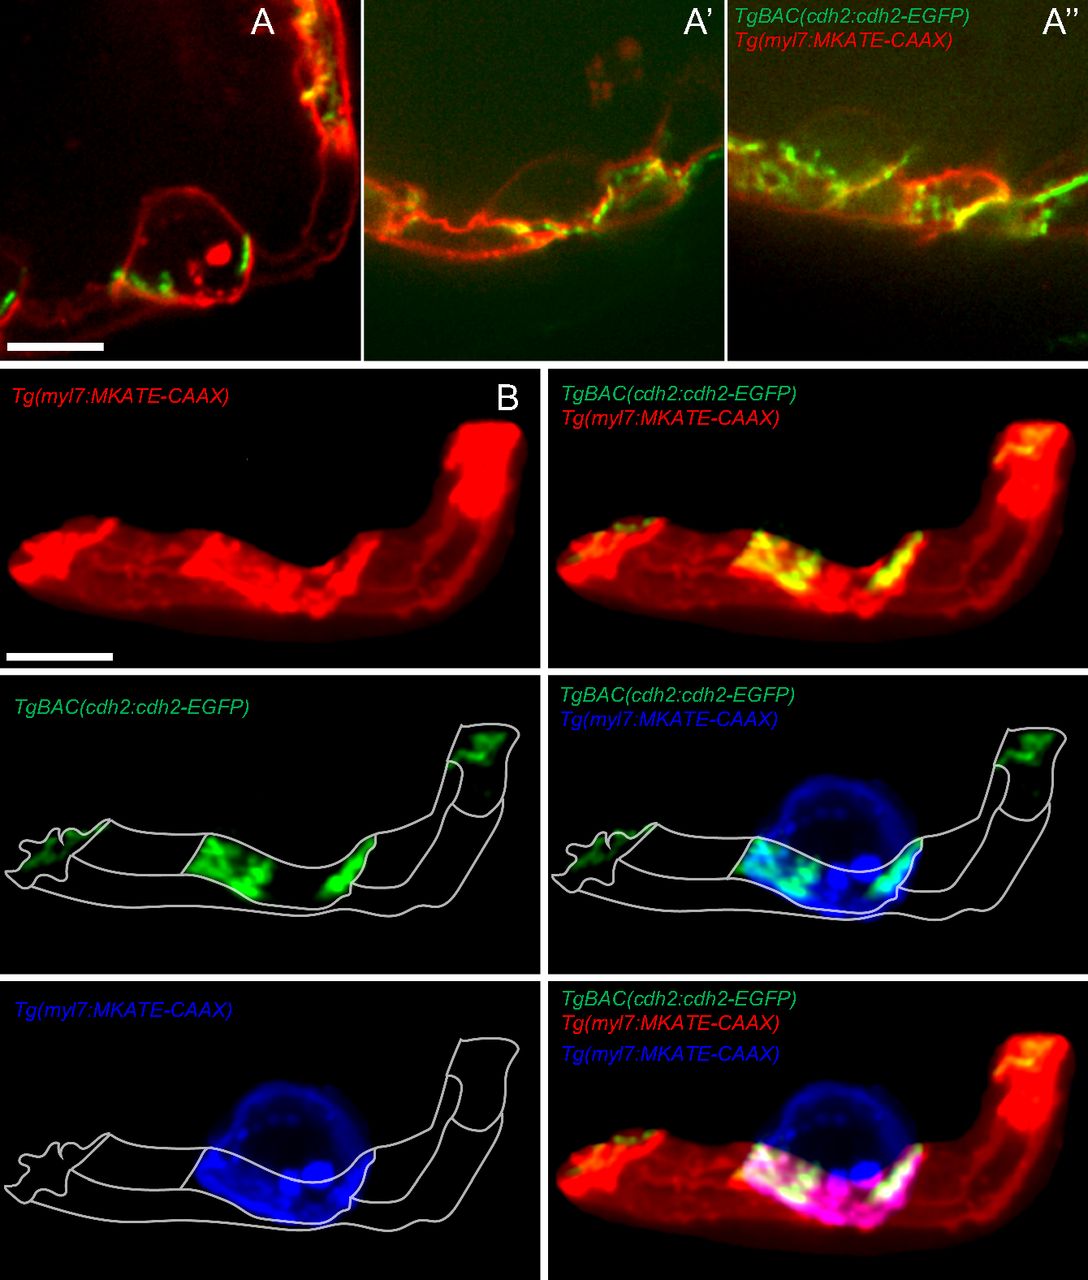
Fig. S3
Localization of Cdh2-EGFP during trabeculation. (A-A′′) 2D picture of three different hearts, showing the localization of Cdh2-EGFP molecules during trabeculation. (B) 3D reconstructed images of cardiomyocytes from A. Red, blue, and green colors are used to represent compact cardiomyocytes, trabecular cardiomyocyte (pseudocoloring), and Cdh2-EGFP molecules, respectively. (Scale bars: 10 µm.)
Acknowledgments
This image is the copyrighted work of the attributed author or publisher, and
ZFIN has permission only to display this image to its users.
Additional permissions should be obtained from the applicable author or publisher of the image.
Full text @ Proc. Natl. Acad. Sci. USA