
|
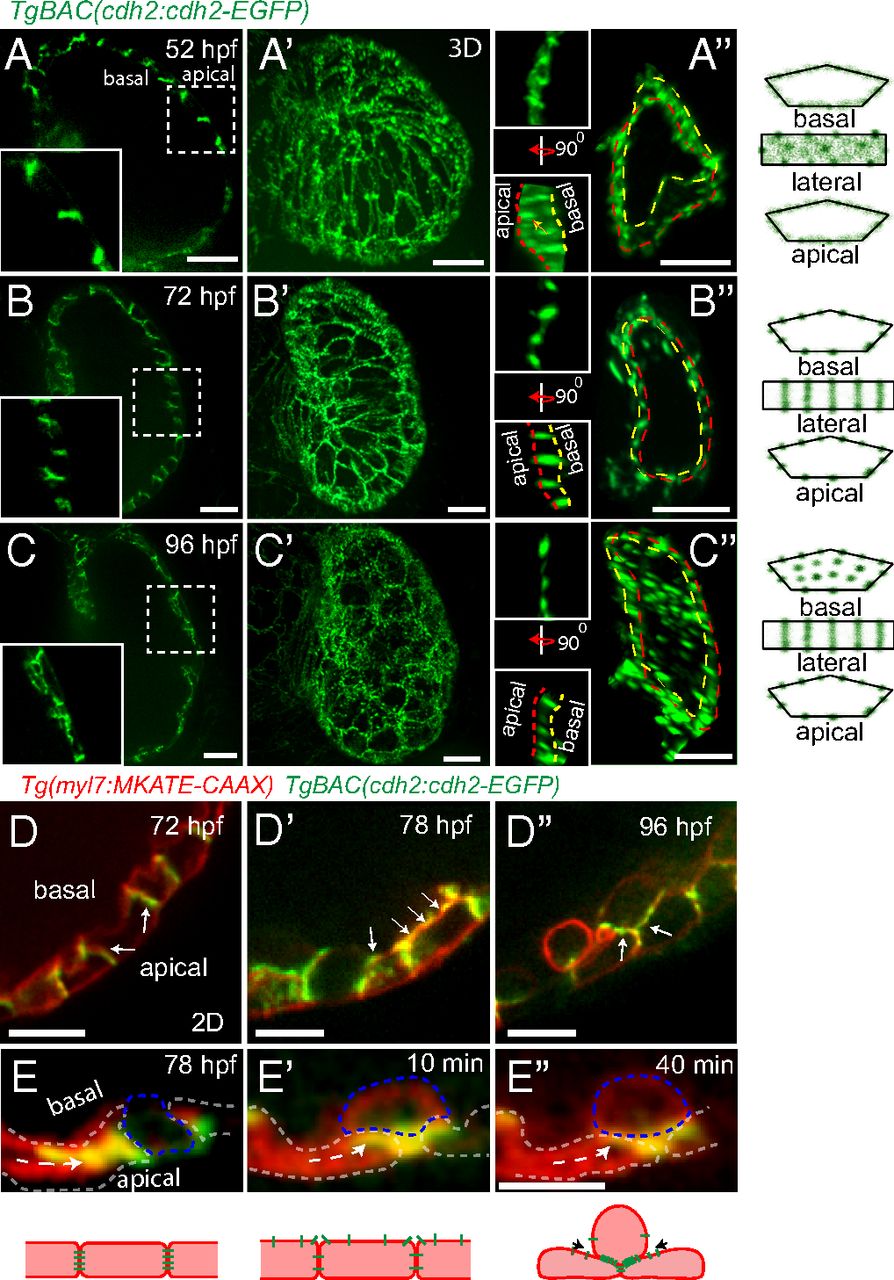
Fig. 1
Dynamic distribution of Cdh2-EGFP during cardiac trabeculation. (A-C) 2D and (A′-C′) 3D views of TgBAC(cdh2:cdh2-EGFP) expression during zebrafish heart development, focusing on the ventricular chamber. (A′′-C′′) 3D views of single cardiomyocytes (see also Movies S1-S3); area outlined by yellow dashed lines represents the basal surface of cardiomyocytes and area between yellow and red dashed lines represents their lateral surface; illustration of Cdh2-EGFP distribution in cardiomyocytes. At 52 hpf, Cdh2-EGFP expression appears evenly distributed; by 72 hpf, punctae appear; and by 96 hpf, Cdh2-EGFP expression appears on the basal side of cardiomyocytes. (D-D′′ and E-E′′) TgBAC(cdh2:cdh2-EGFP);Tg(myl7:MKATE-CAAX) expression in developing hearts. Cdh2-EGFP is initially localized at the lateral side of cardiomyocytes (D); it is then also observed on the basal side of cardiomyocytes (D′); and after cardiomyocytes delaminate, it can be observed between compact layer cardiomyocytes and adjacent trabecular cardiomyocytes (D′′); white arrows point to Cdh2-EGFP expression (cartoon representation is shown below). (E-E′′) Redistribution of Cdh2-EGFP to the surface of compact layer cardiomyocytes directly adjacent to trabecular cardiomyocytes. Arrows indicate the apparent movement of Cdh2-EGFP (Movie S5). (Scale bars, 10 µm in A-C, A′-C′, A′′-C′′, and D-D′′; 5 µm in E′′.)