
Image
|
Figure Caption
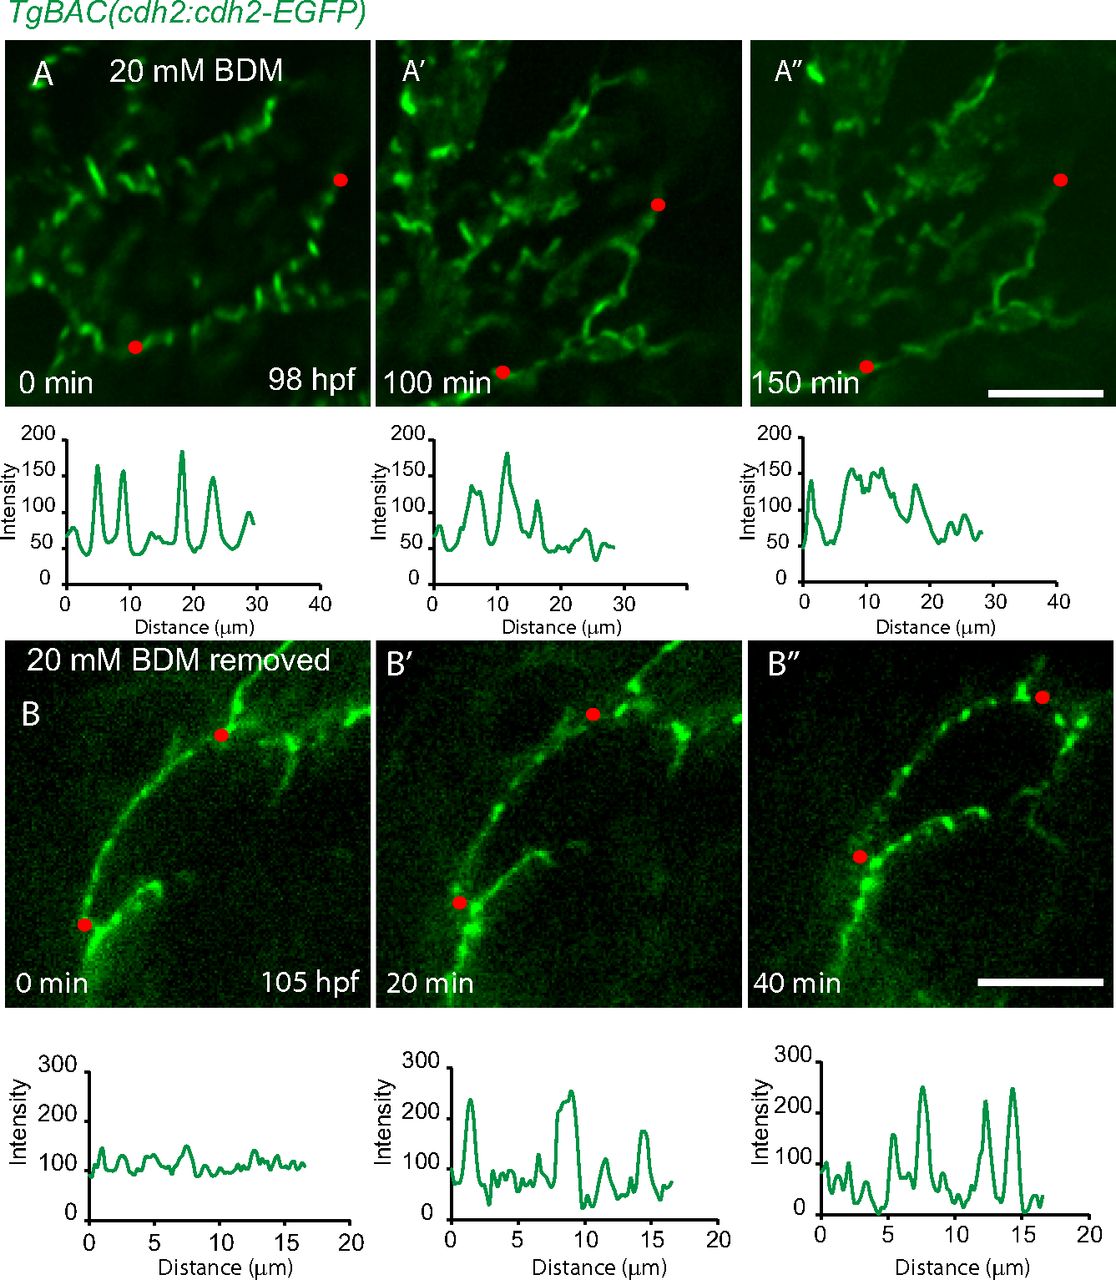
Fig. S6
Cardiac contraction is essential for Cdh2 clustering. 2D views of TgBAC(cdh2:cdh2-EGFP) hearts. Line scan quantification of Cdh2-EGFP signal in the region depicted by the red dotted line. (A-A′′) After treatment with BDM, Cdh2-EGFP expression became evenly distributed. (B-B′′) Removal of BDM resulted in the reclustering of Cdh2-EGFP expression into a punctate pattern. (Scale bars: 10 µm.)
Acknowledgments
This image is the copyrighted work of the attributed author or publisher, and
ZFIN has permission only to display this image to its users.
Additional permissions should be obtained from the applicable author or publisher of the image.
Full text @ Proc. Natl. Acad. Sci. USA