
Image
|
Figure Caption
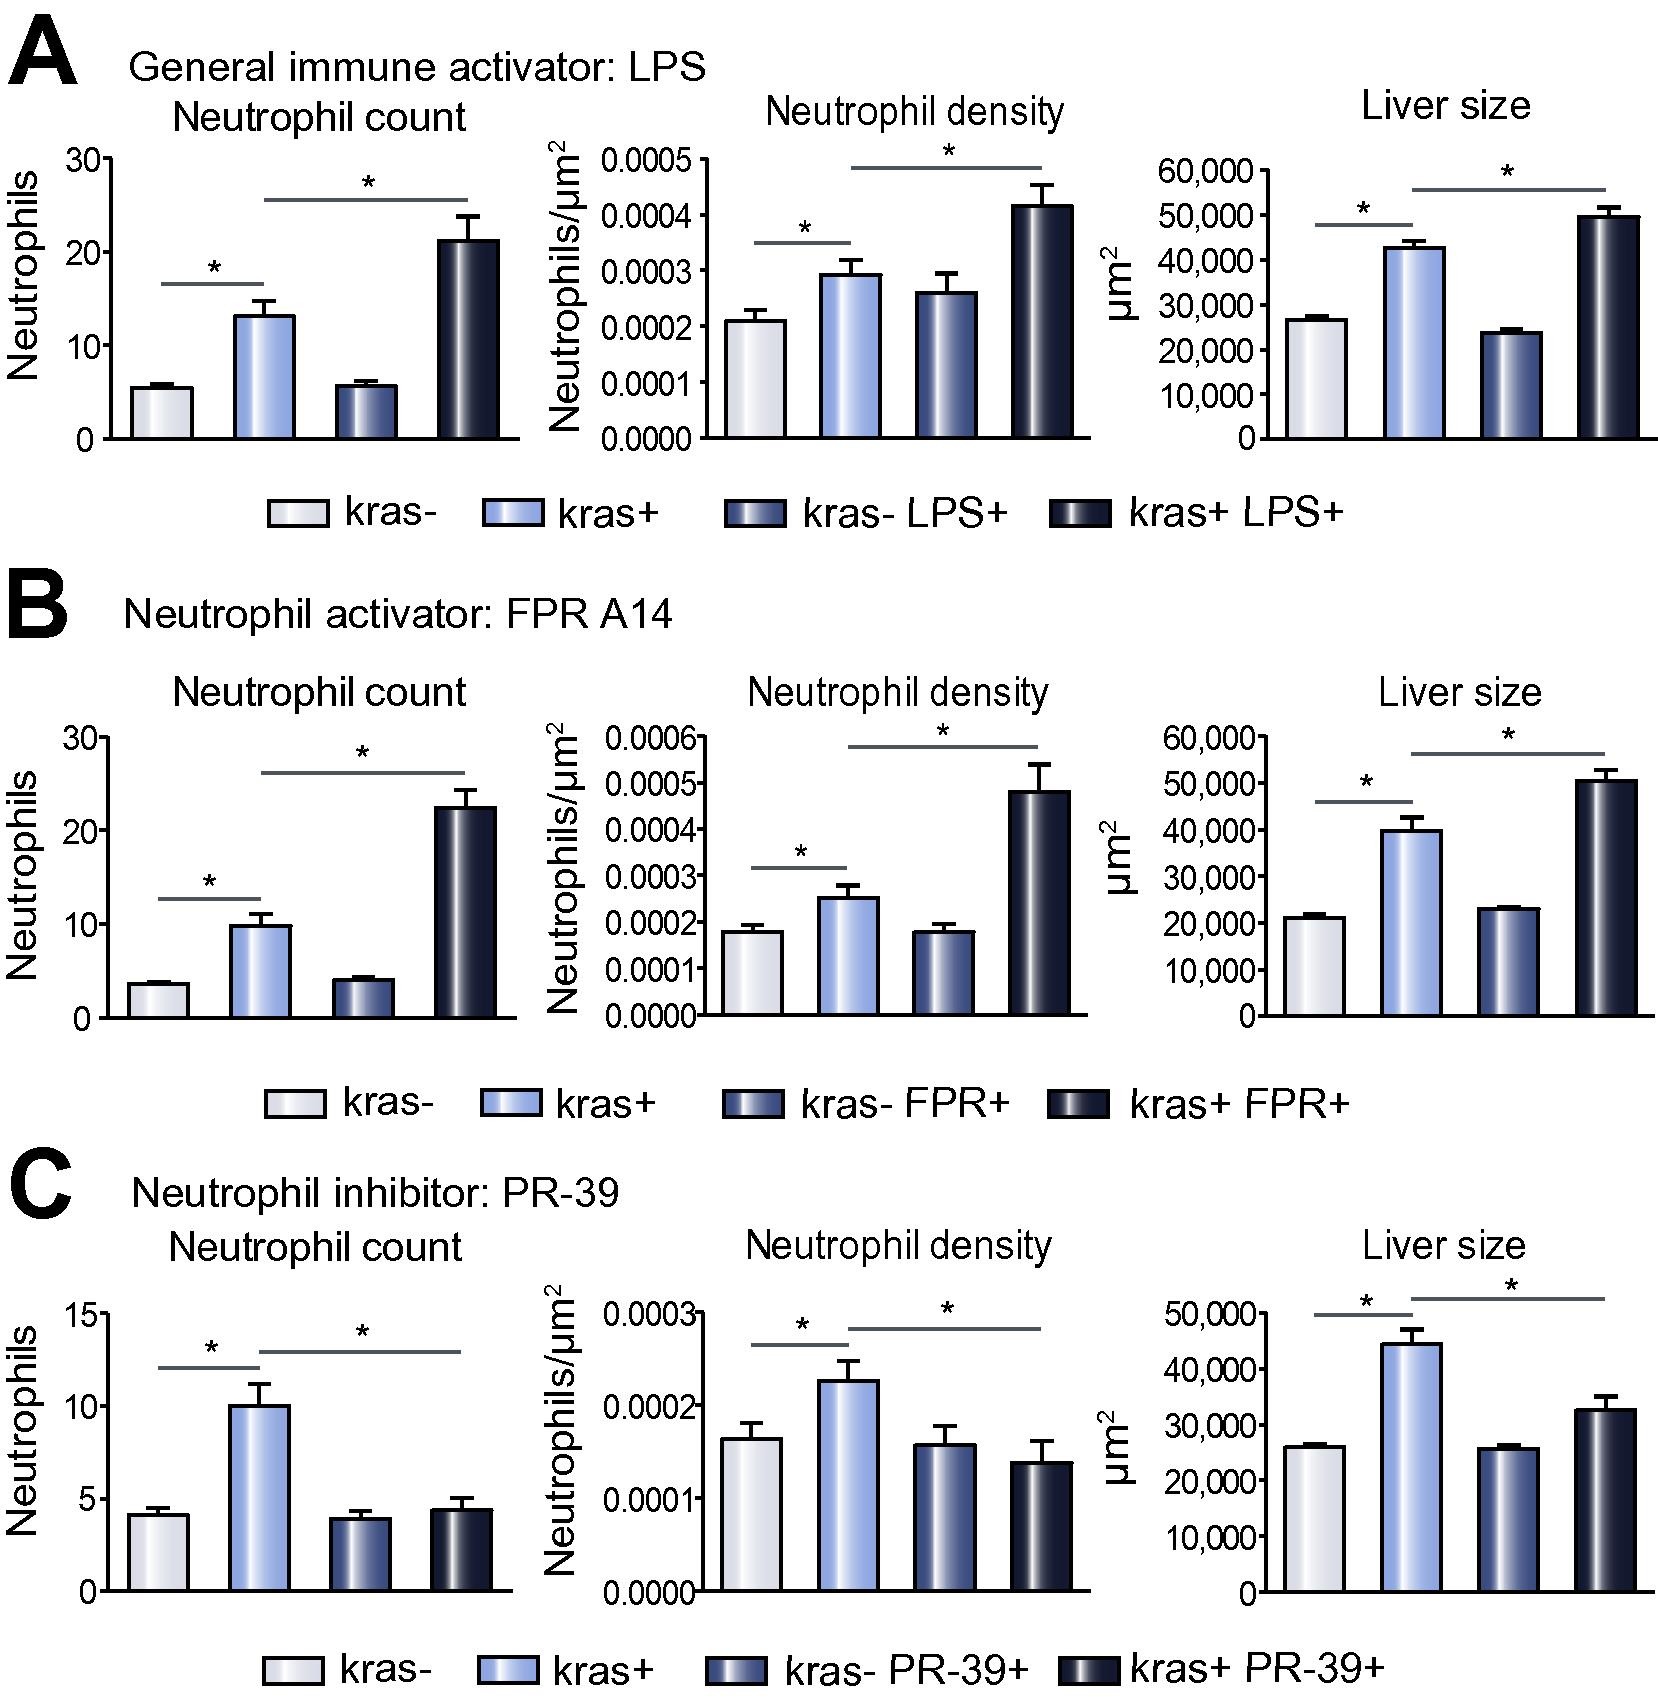
Fig. 2
Effect of infiltrated neutrophils on liver size. (A-C) Neutrophil counts (left) and density (middle) in the liver area and liver size (right) in response to treatments of LSP (A), FPR A14 (B) or PR39 (C). Both kras-/lyz+ and kras+/lyz+ groups were similarly exposed to doxycycline from 3 dpf and neutrophils mediators were added from 4 dpf. Neutrophils and liver sizes were determined at 8 dpf (n >15 from each group). Statistical significance: *p <0.05.
Figure Data
Acknowledgments
This image is the copyrighted work of the attributed author or publisher, and
ZFIN has permission only to display this image to its users.
Additional permissions should be obtained from the applicable author or publisher of the image.
Reprinted from Journal of hepatology, 63(2), Yan, C., Huo, X., Wang, S., Feng, Y., Gong, Z., Stimulation of hepatocarcinogenesis by neutrophils upon induction of oncogenic kras expression in transgenic zebrafish, 420-8, Copyright (2015) with permission from Elsevier. Full text @ J. Hepatol.