
Fig. 3
- ID
- ZDB-IMAGE-160803-31
- Genes
- Publication
- Shin et al., 2014 - Efficient homologous recombination-mediated genome engineering in zebrafish using TALE nucleases
- All Figures
- Figures for Shin et al., 2014
|
Fig. 3
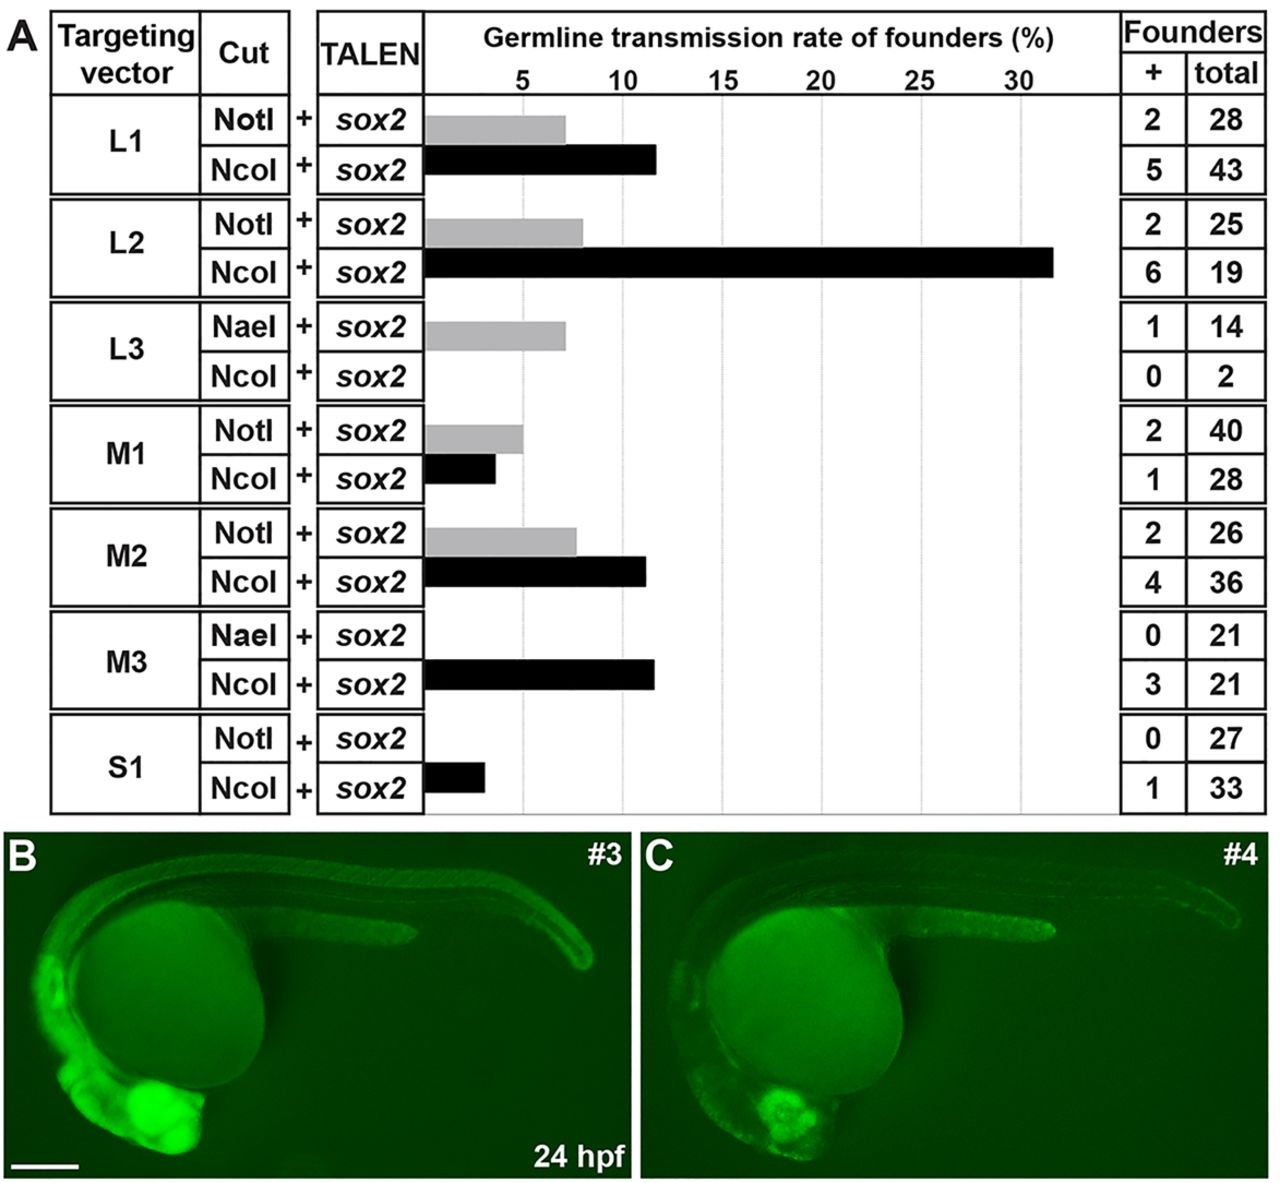
Germline transmission rates of sox2-2a-sfGFP knock-in lines. (A) The frequency of germline transmission of the founders that were co-injected with sox2 TALEN and each targeting construct, which was linearized by either NotI or NcoI. The bars represent the percentage of F0 founders that produced sfGFP-positive F1 progeny. (B,C) Comparison of sfGFP expression between strong and weak sox2-2a-sfGFP F1 embryos. Epifluorescence stereomicroscopic images of sfGFP expression. Lateral views of 1dpf embryos. Both images were taken with the same exposure time. (B) The strong sfGFP-positive F1 embryos obtained from line 3. (C) The weak sfGFP-positive F1 embryos obtained from line 4. Scale bar: 200µm.