
Fig. 6
- ID
- ZDB-IMAGE-160802-6
- Publication
- Cacialli et al., 2016 - BDNF Expression in Larval and Adult Zebrafish Brain: Distribution and Cell Identification
- All Figures
- Figures for Cacialli et al., 2016
|
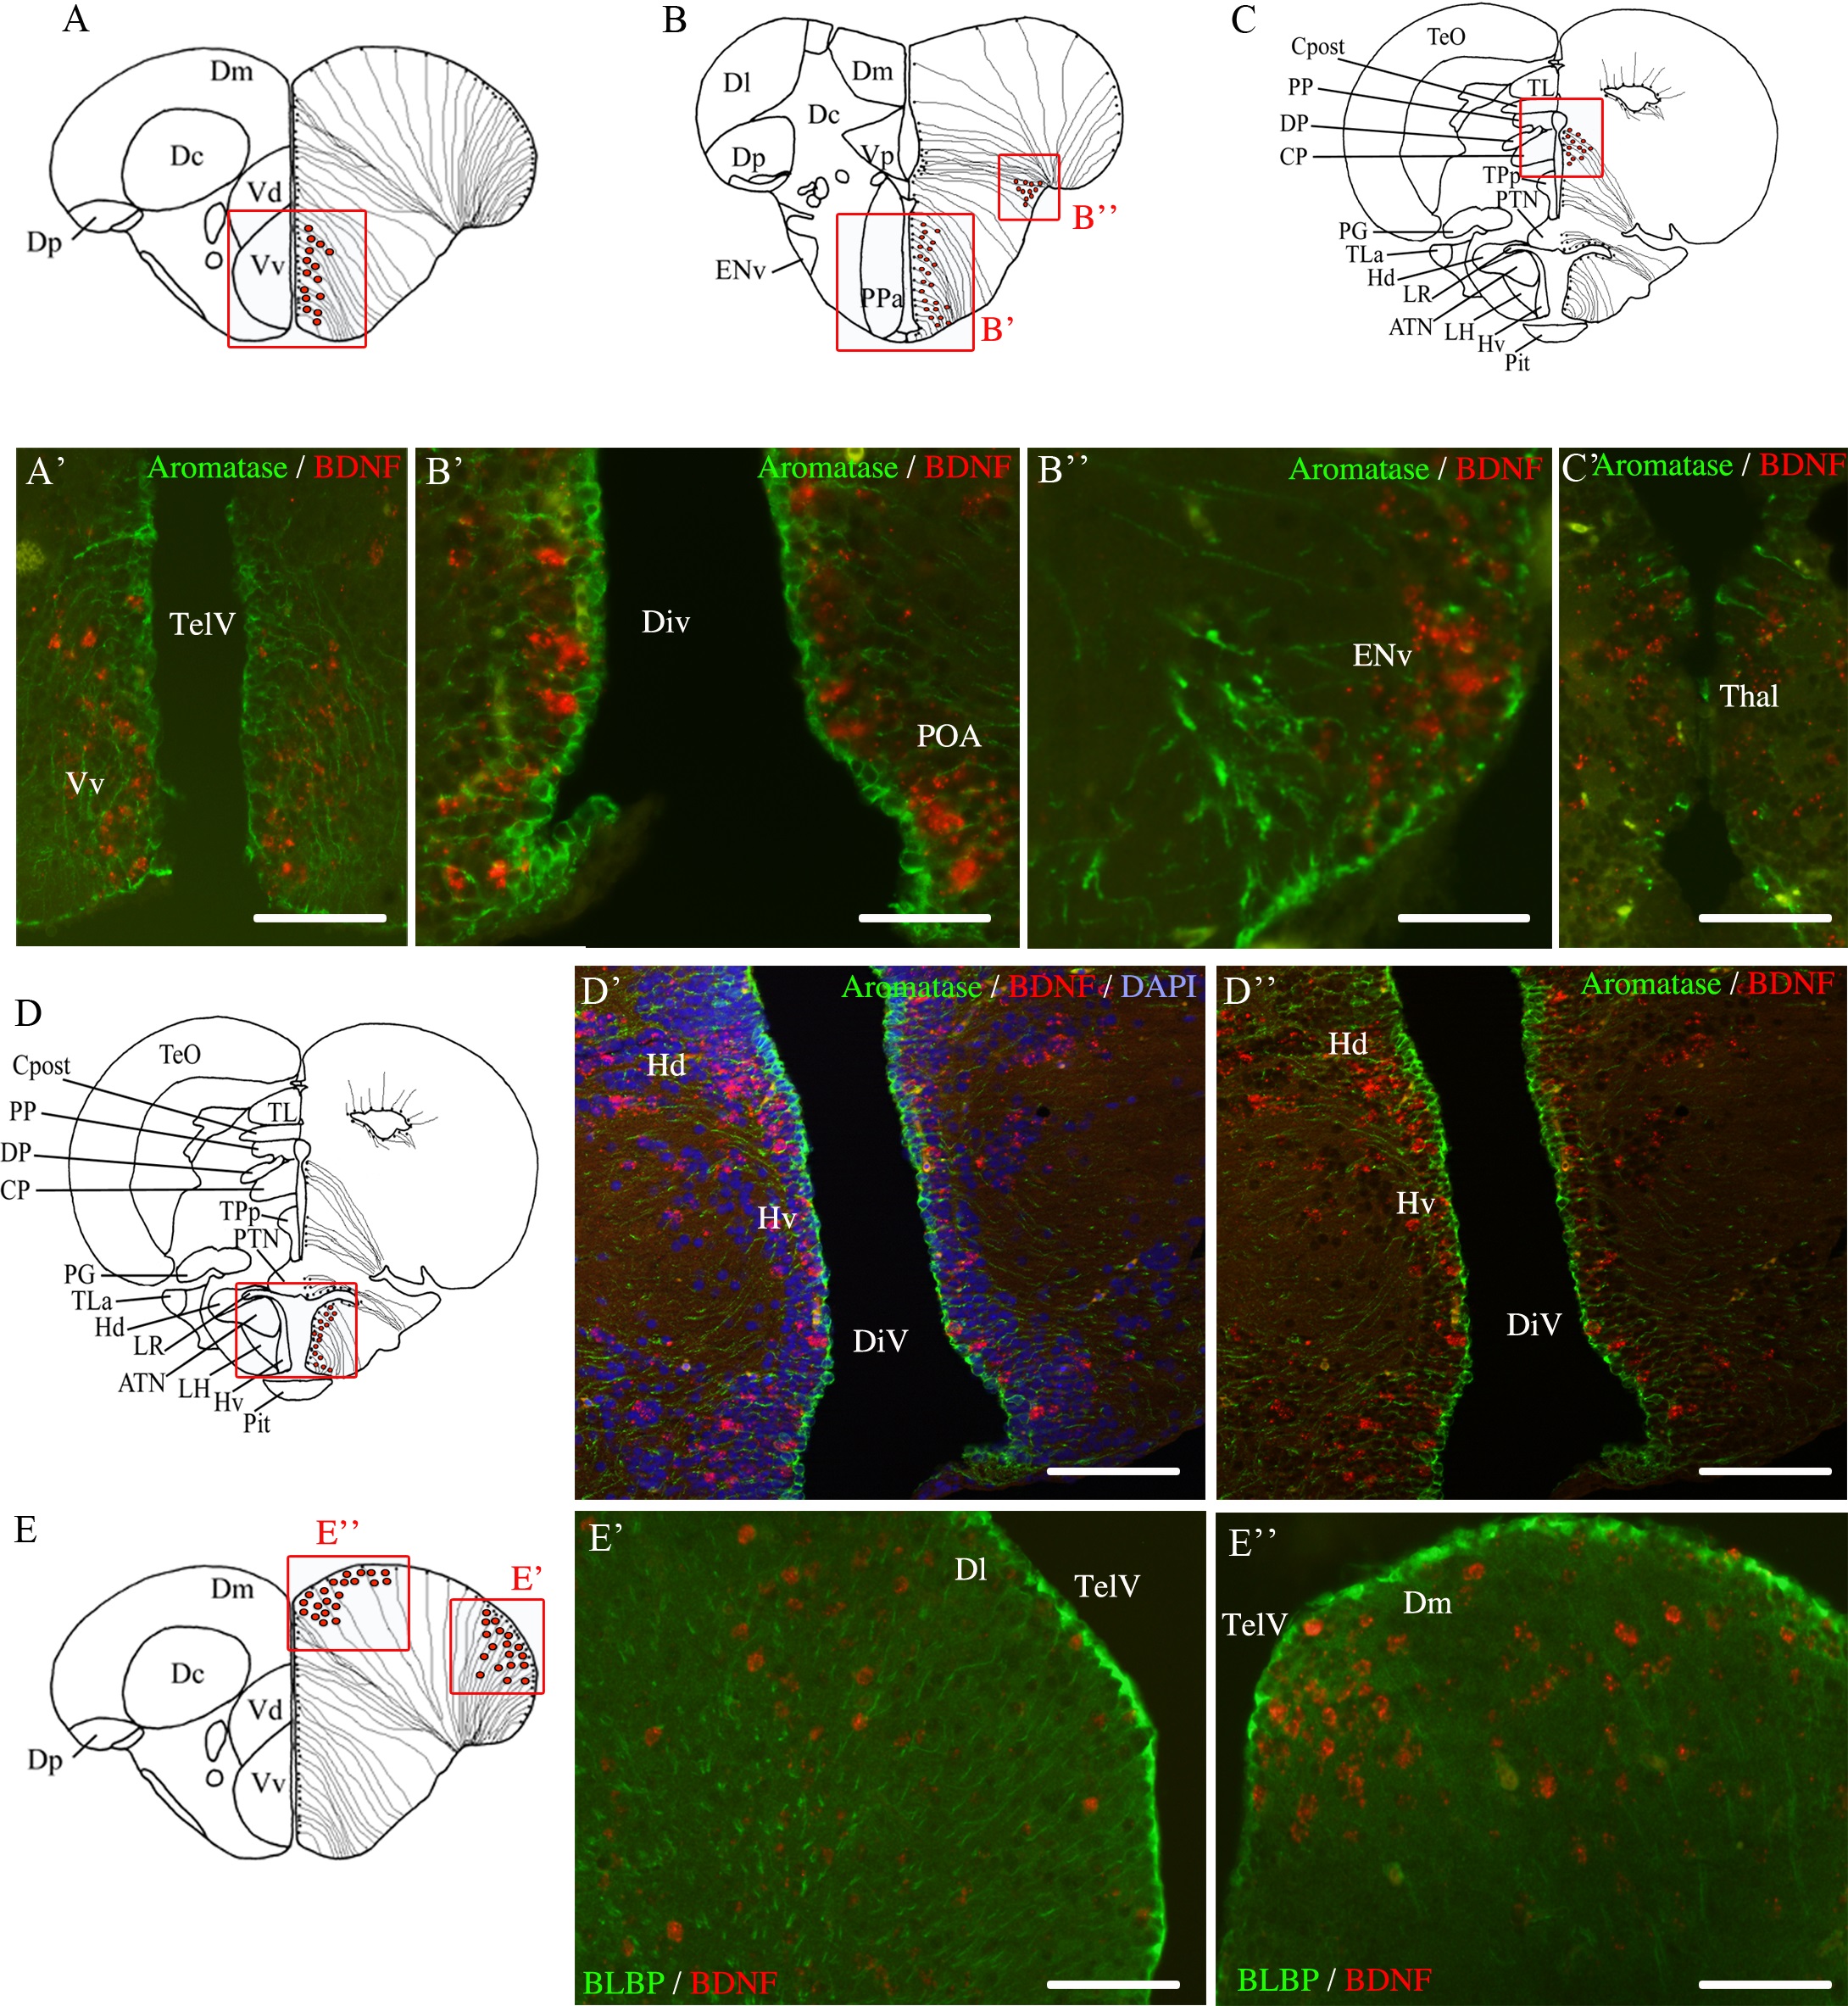
Fig. 6
Immunohistochemical characterization of bdnf-expressing cells in adult zebrafish brain.
A, B, C, D and E are representative sections taken from the zebrafish atlas (Wullimann et al., 1996). Bdnf-expressing cells are represented by red dots and Aromatase B (A-D) or BLBP-labeled cells (E) are represented by black dots with thin lines indicating radial glia cytoplasmic processes. Double staining for bdnf mRNA (red) and Aromatase B protein (green) on cross-sections through the telencephalon (A-A′), the preoptic area (B-B′), the entopedoncular nucleus (B-B′′), the thalamus (C-C′) and the ventral hypothalamus (D-D′′). Double staining for bdnf mRNA (red) and BLBP protein (green) on cross-sections through the telencephalon (E-E′′). DiV: diencephalic ventricle; Dl: lateral zone of the dorsal telencephalon; Dm: medial zone of the dorsal telencephalon; ENv: endopedoncular nucleus; Hd: dorsal zone of the periventricular hypothalamus; Hv: ventral zone of the periventricular hypothalamus; POA: preoptic area; TelV: telencephalic ventricle; Vv: ventral zone of the ventral telencephalon. D′ and D′′ are obtained with an Apotome-equipped Zeiss. Scale bar = 60 µm in A′, C′, D′, D′′, E′ and E′′; 30 µm in B′ and B′′.