
Fig. 4
- ID
- ZDB-IMAGE-160802-4
- Publication
- Cacialli et al., 2016 - BDNF Expression in Larval and Adult Zebrafish Brain: Distribution and Cell Identification
- All Figures
- Figures for Cacialli et al., 2016
|
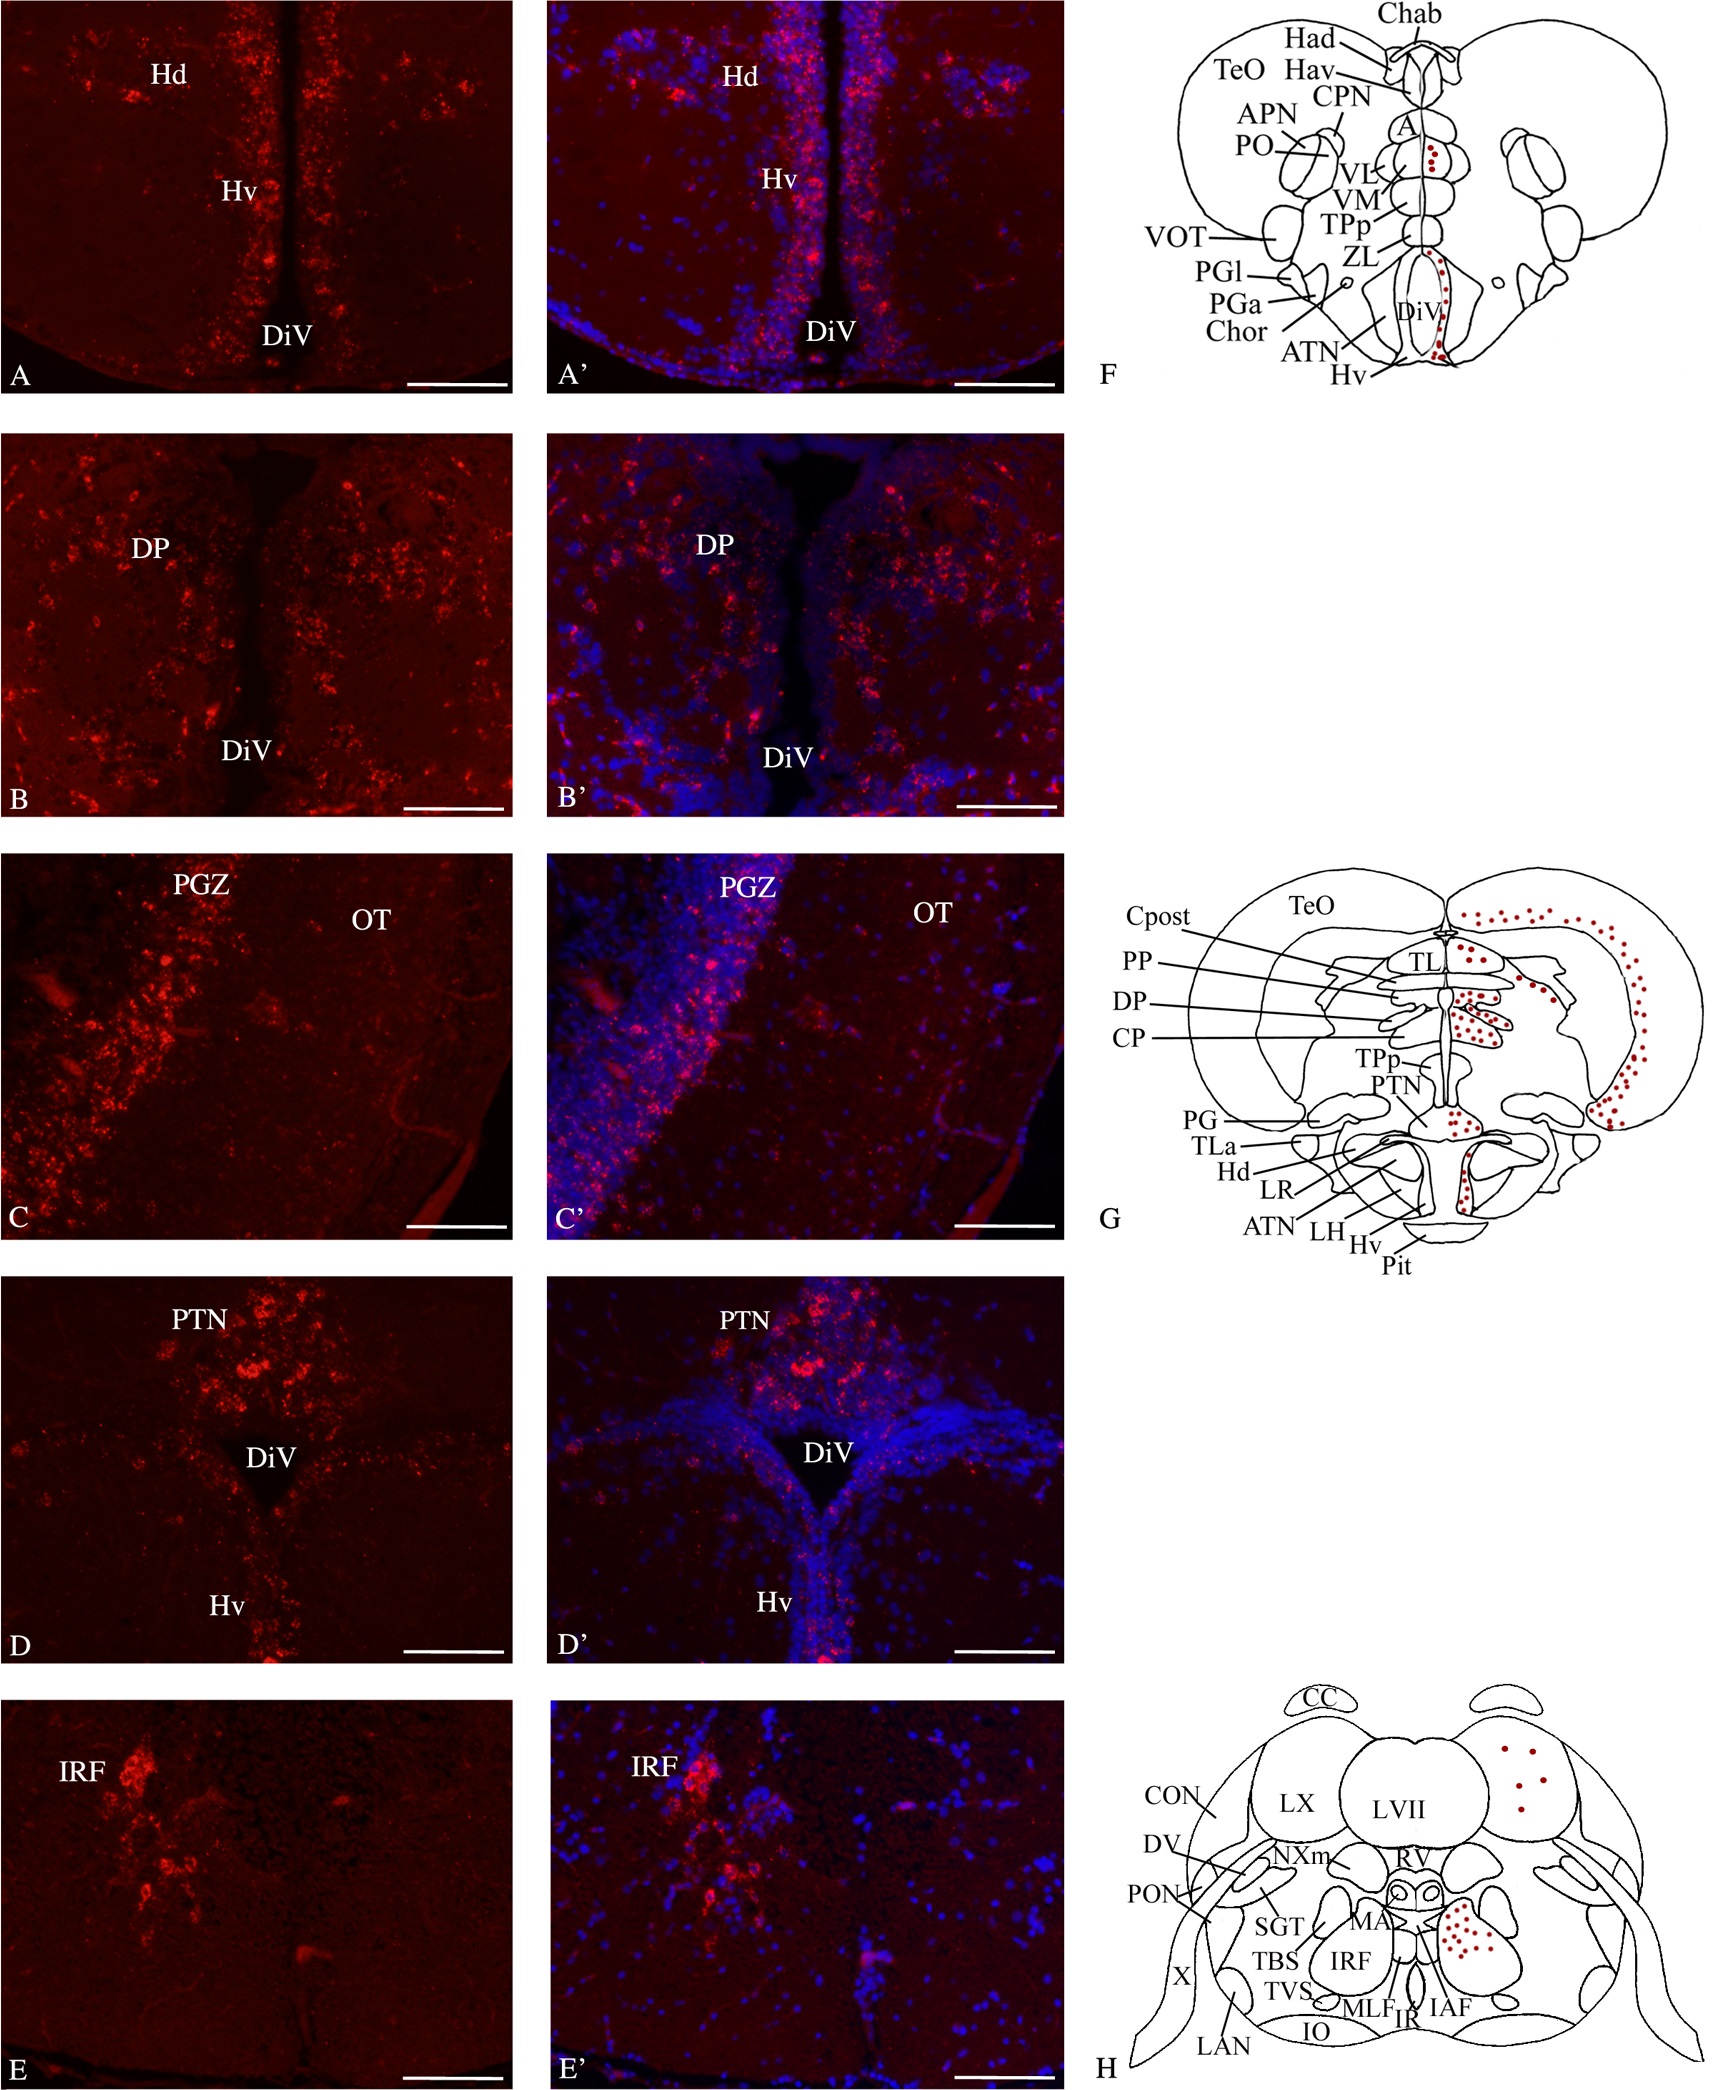
Fig. 4
Bdnf mRNA distribution in cross-sections through the adult zebrafish mid- and hindbrain.
In the ventral hypothalamus (A, A′, F and G), the dorsal thalamic region (B, B′), the optic tectum (C, C′ and G), the posterior tuberal nucleus (D, D′ and G) and medulla oblongata (E, E′ and H). In A′, B′, C′, D′ and E′, cell nuclei are labeled in blue with DAPI. F, G and H are representative sections taken from the zebrafish atlas (Wullimann et al., 1996). Bdnf-expressing cells are represented by red dots. DiV: diencephalic ventricle, DP: dorsal thalamic nucleus; Hd: dorsal zone of the periventricular hypothalamus; Hv: ventral zone of the periventricular hypothalamus; IRF: inferior reticular formation; OT: optic tectum; PGZ: periventricular gray zone of the optic tectum. PTN: posterior tuberal nucleus. Scale bar: 120 µm.