
Fig. 3
- ID
- ZDB-IMAGE-160802-3
- Publication
- Cacialli et al., 2016 - BDNF Expression in Larval and Adult Zebrafish Brain: Distribution and Cell Identification
- All Figures
- Figures for Cacialli et al., 2016
|
Fig. 3
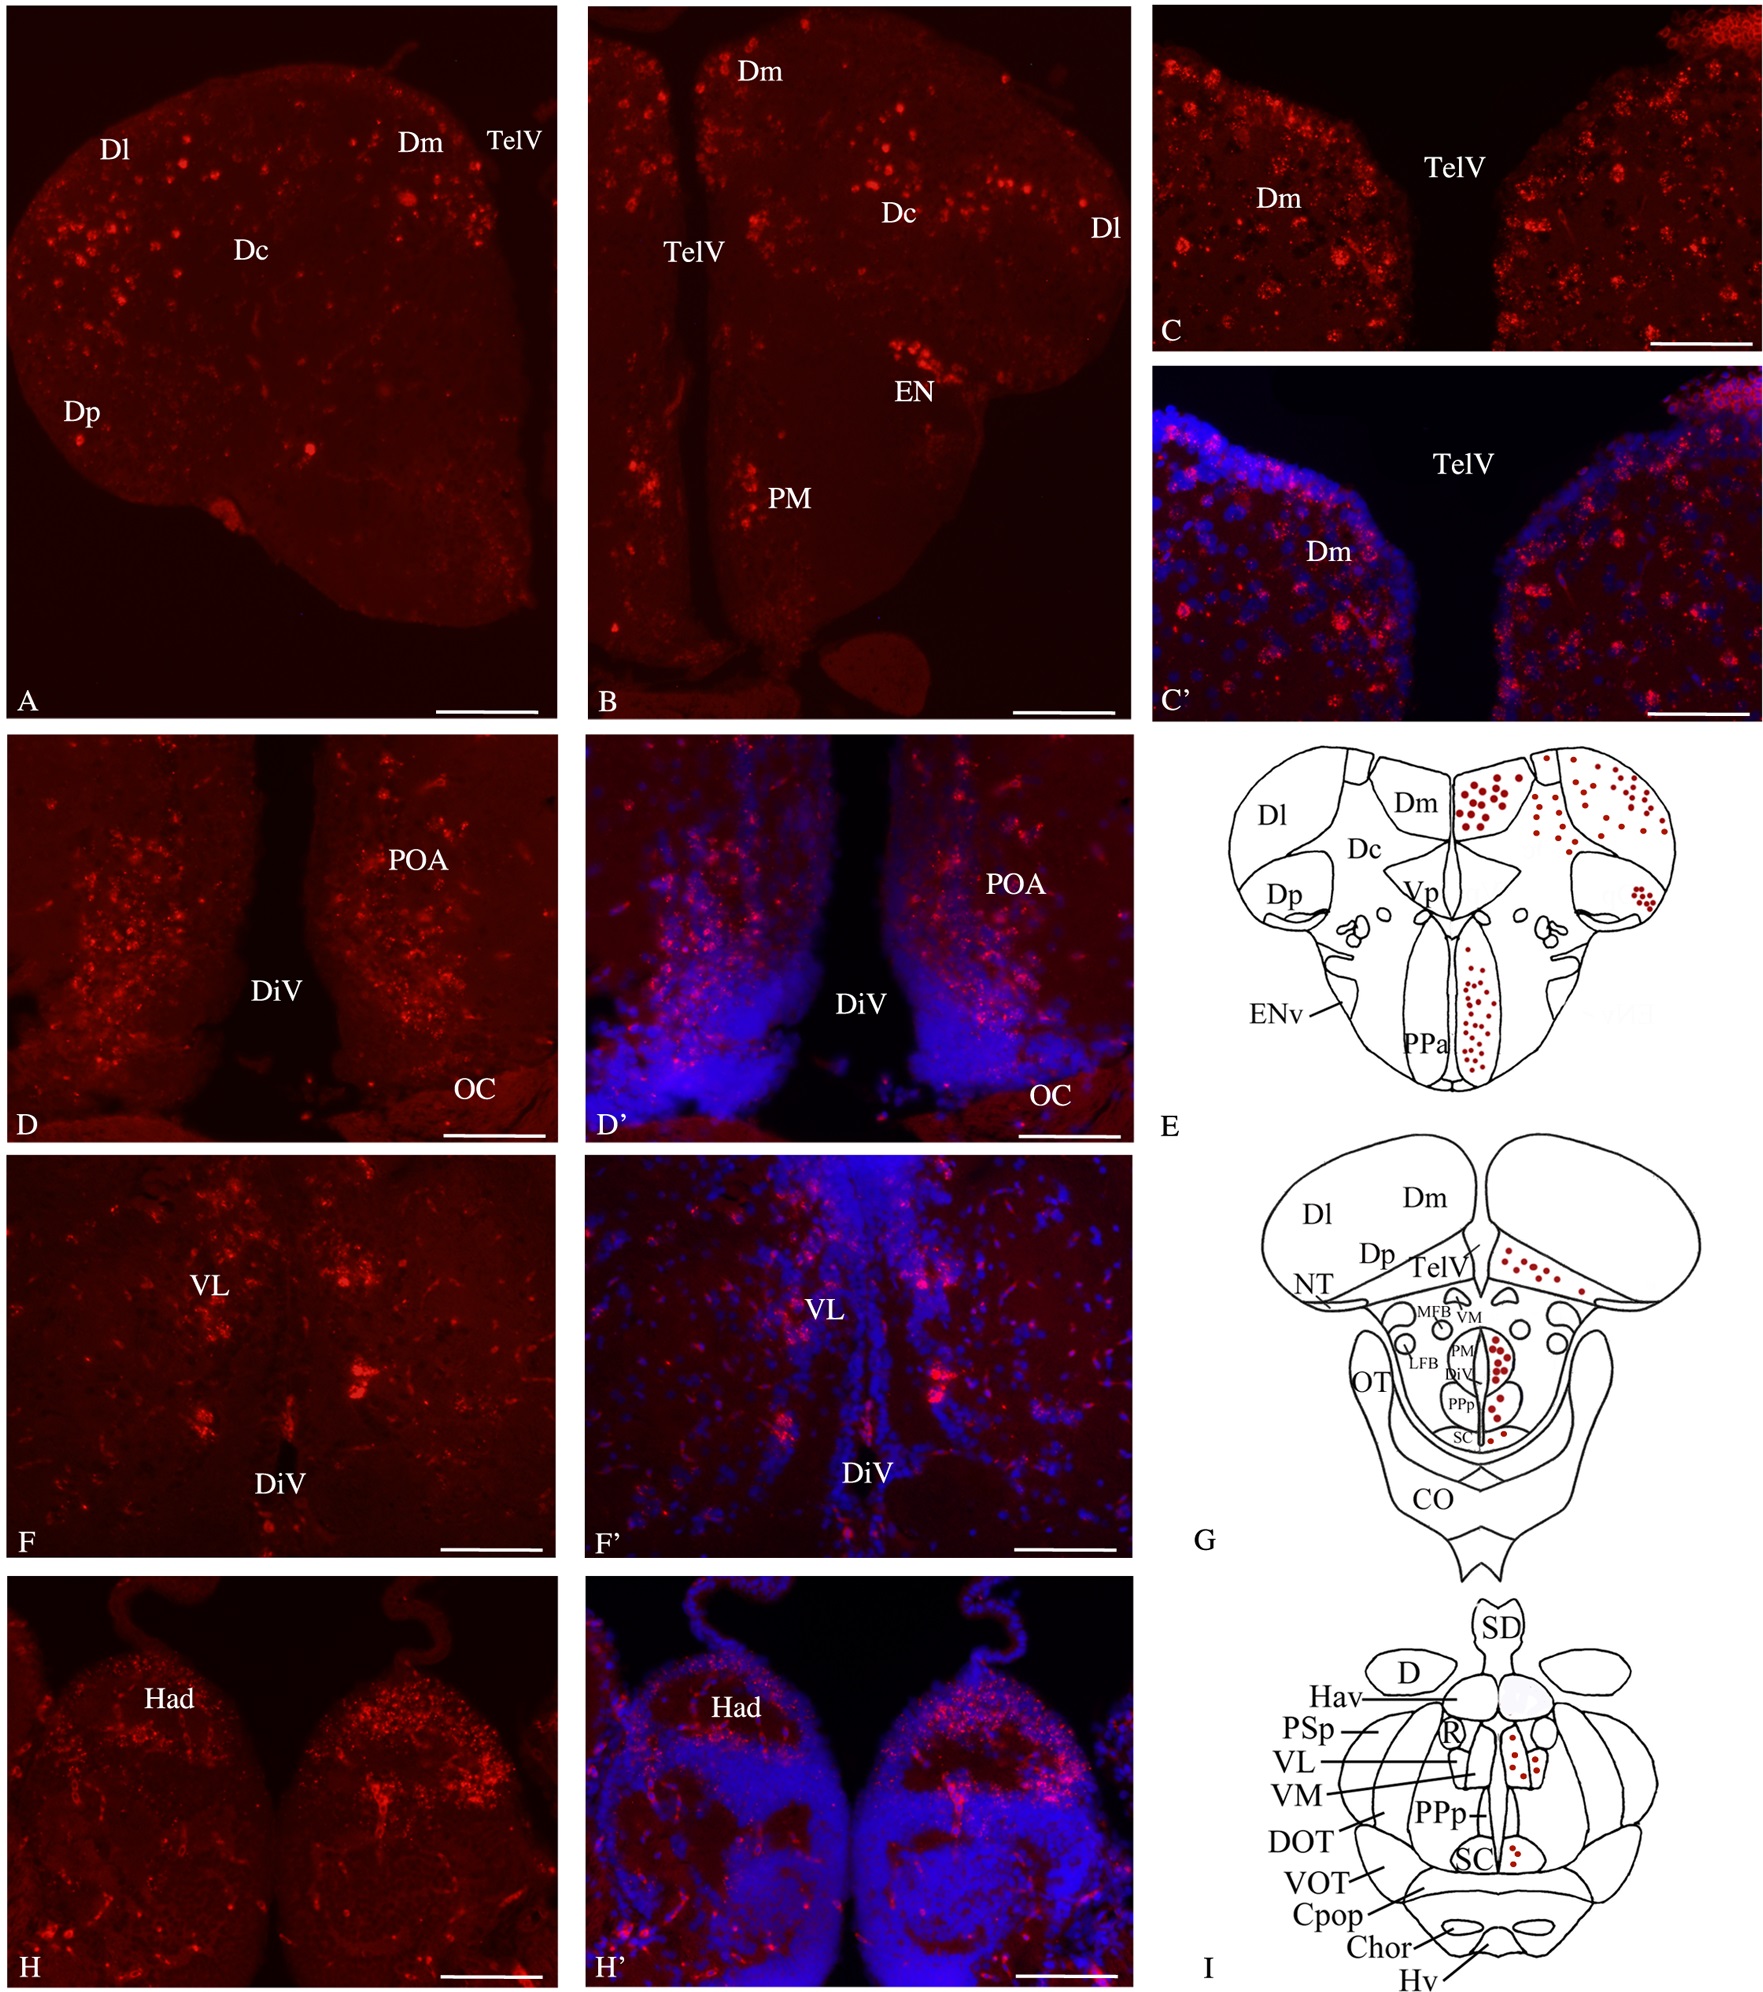
Bdnf mRNA distribution in cross-sections through the adult zebrafish forebrain.
Telencephalon (A, B, C, C′ and E), preoptic area (B, D, D′ and E, G), thalamus (F, F′ and I) and dorsal habenula (H, H′). In C′, D′, F′, H′ cell nuclei are labeled in blue with DAPI. E, G and I are representative sections taken from the zebrafish atlas (Wullimann et al., 1996). Bdnf-expressing cells are represented by red dots. Dc: central zone of the dorsal telencephalon; DiV: diencephalic ventricle; Dl: lateral zone of the dorsal telencephalon; Dm: medial zone of the dorsal telencephalon; Dp: posterior zone of the dorsal telencephalon; EN: endopedoncular nucleus; Had: dorsal habenular nucleus; PM: magoncellular preoptic nucleus; OC: optic chiasma; POA: preoptic area; TelV: telencephalic ventricle; VL: ventrolateral thalamic nuclei. Scale bar: 120 µm except in C and C′: 60 µm.