
|
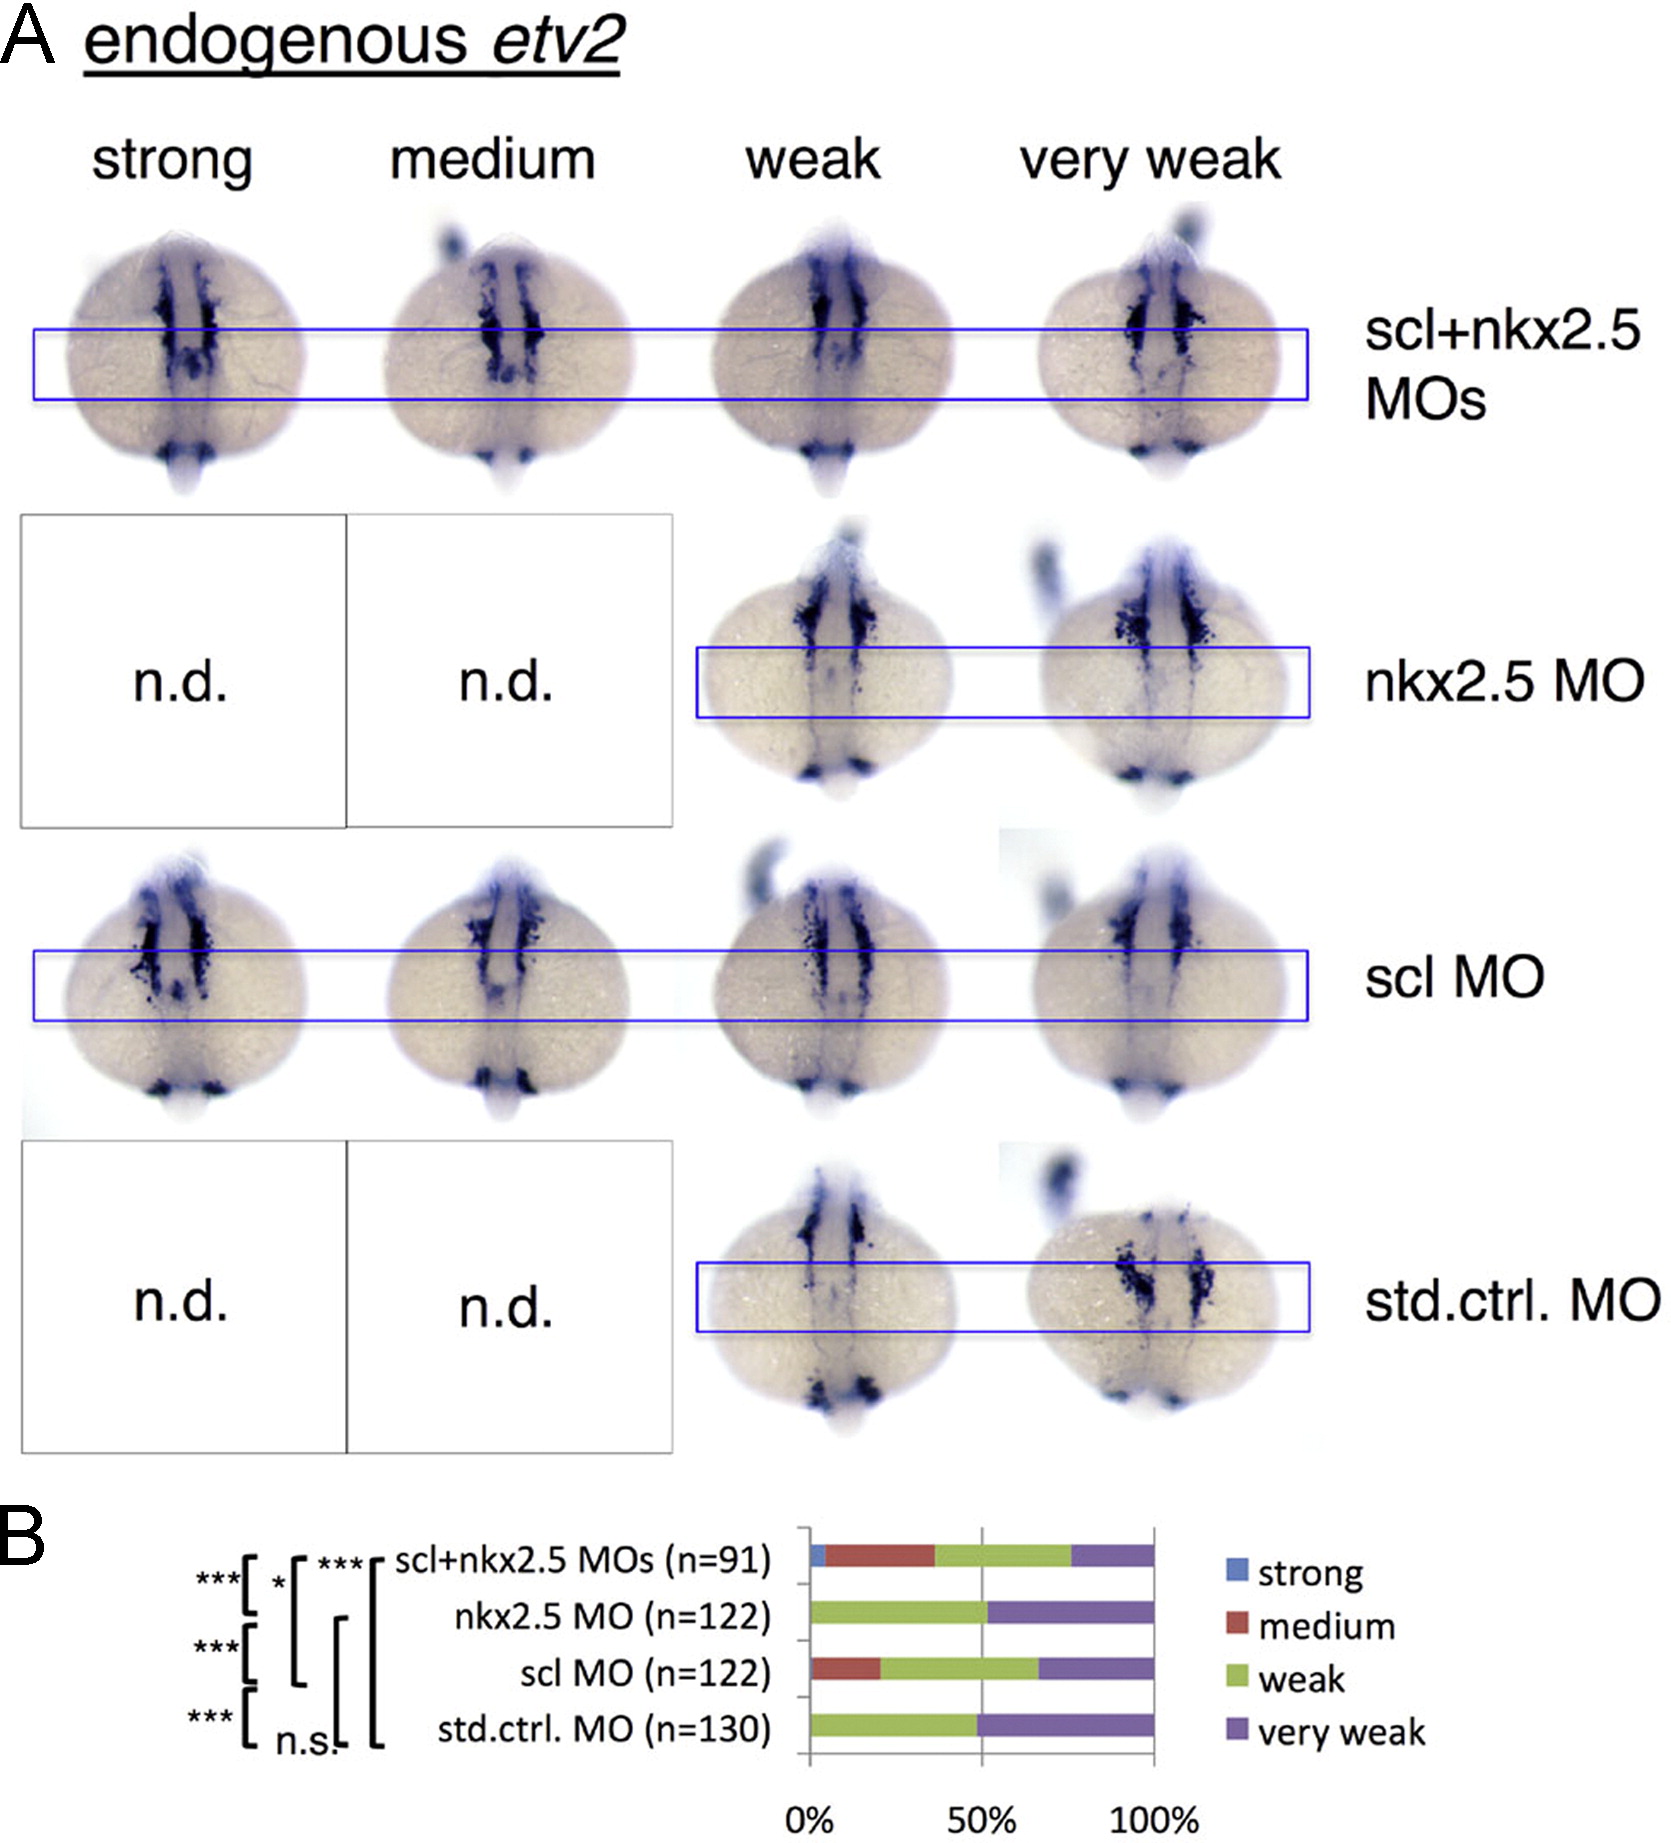
Fig. 5
Response of endogenous etv2 expression to single and combined knockdowns of nkx2.5 and scl in the cardiac disc: (A) representative embryos showing categories of etv2 expression in the endocardial domain of the cardiac disc following single and combined knockdowns of scl and nkx2.5 and quantification in (B). Note that single nkx2.5 morpholino knockdown resulted in no significant modulation of etv2 expression but further increased the effect of scl morpholino in double knockdown experiments. Embryos shown are at 20-22 som stages in dorsal view with anterior to the top. *** indicates p≤0.001; ** indicates pd0.01; * indicates p≤0.05, n.s.=not significant (p>0.05); n.d.=not detected; MO=morpholino; n=number of scored embryos; blue frame marks the endocardial cardiac disc expression domain of etv2. Categories of transgene expression magnitudes scored are color-coded in (B).
Reprinted from Developmental Biology, 393(1), Schupp, M.O., Waas, M., Chun, C.Z., Ramchandran, R., Transcriptional inhibition of etv2 expression is essential for embryonic cardiac development, 71-83, Copyright (2014) with permission from Elsevier. Full text @ Dev. Biol.