
|
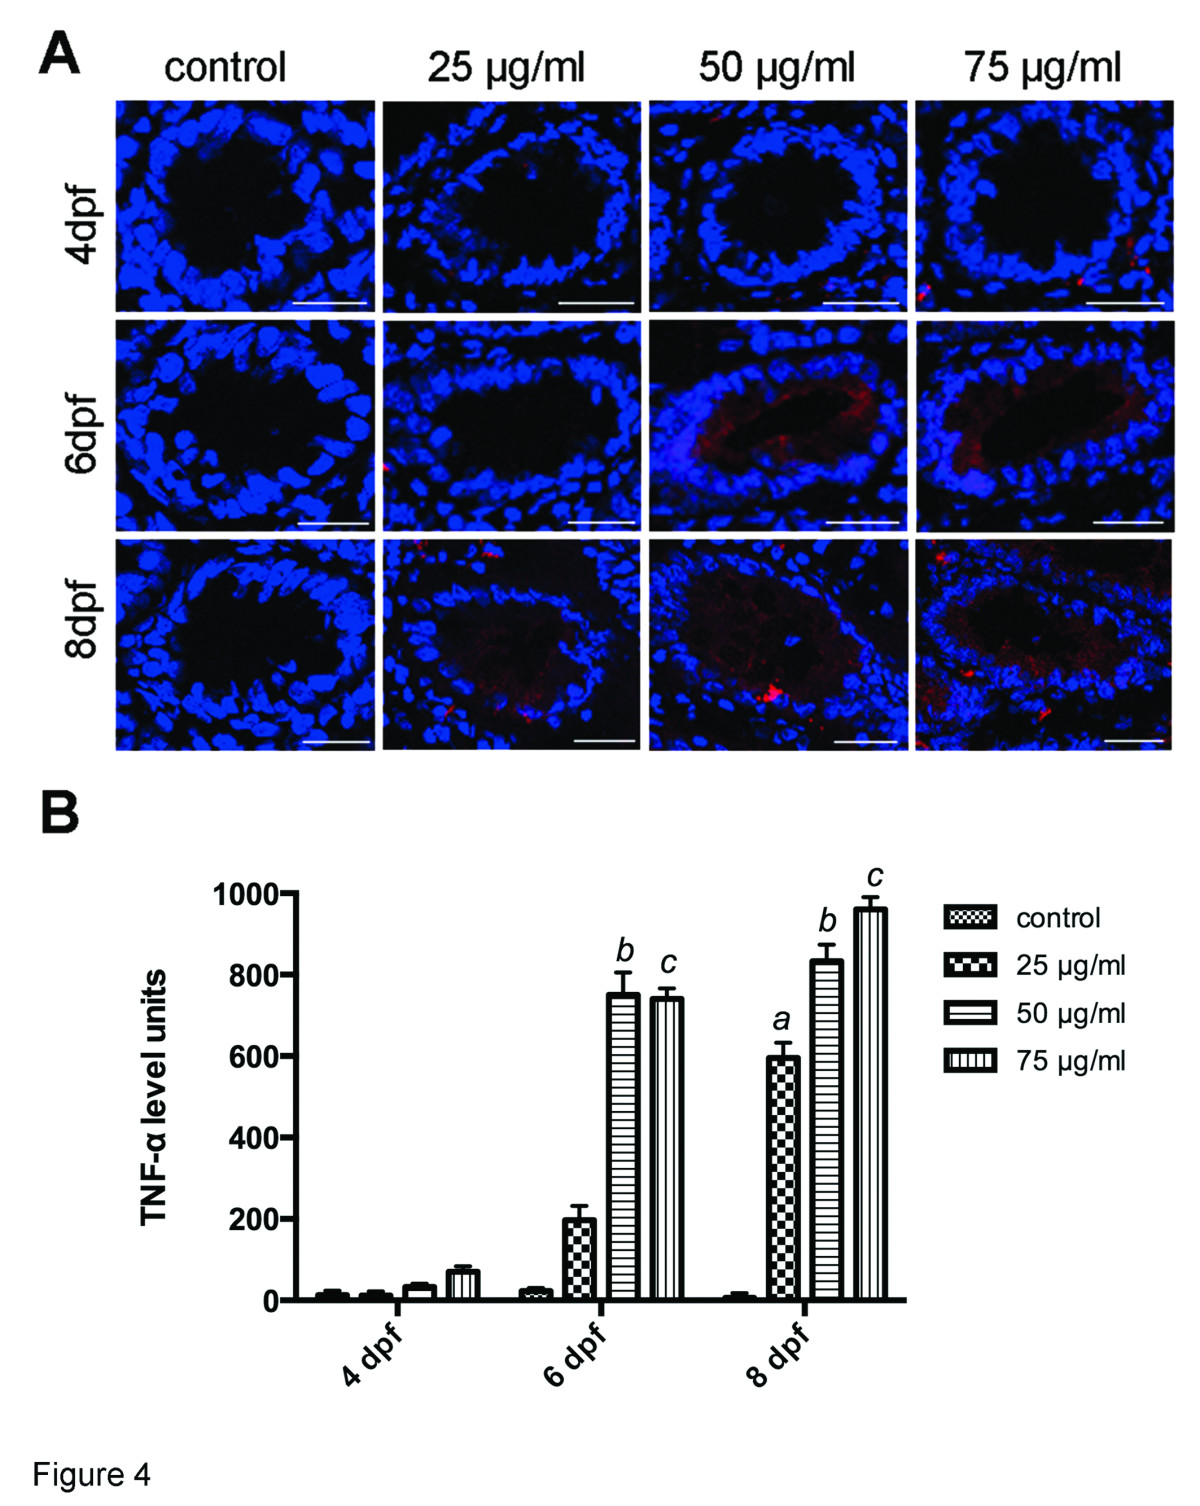
Fig. 4
Immunofluorescence analysis of TNF-α expression in gut. A: TNF-α expression was stimulated in larvae exposed to TNBS. TNF-α staining (red) and DAPI staining (blue) images were visualized by confocal laser scanning microscopy. Bars: 25 µm. B: TNF-α immunofluorescence levels increased with increasing concentrations of TNBS over time. All error bars represent as mean ± SEM, n=13-16 sections per group, a Indicates a significant difference (p<0.05) between TNBS-exposed group (25 µg/ml) and the control, b Indicates a significant difference (p<0.05) between TNBS-exposed group (50 µg/ml) and the control, c Indicates a significant difference (p<0.05) between TNBS-exposed group (75 µg/ml) and the control, d Indicates a significant difference (p<0.05) between control groups at 6 dpf and 4 dpf, e Indicates a significant difference (p<0.05) between control groups at 8 dpf and 4 dpf.