
|
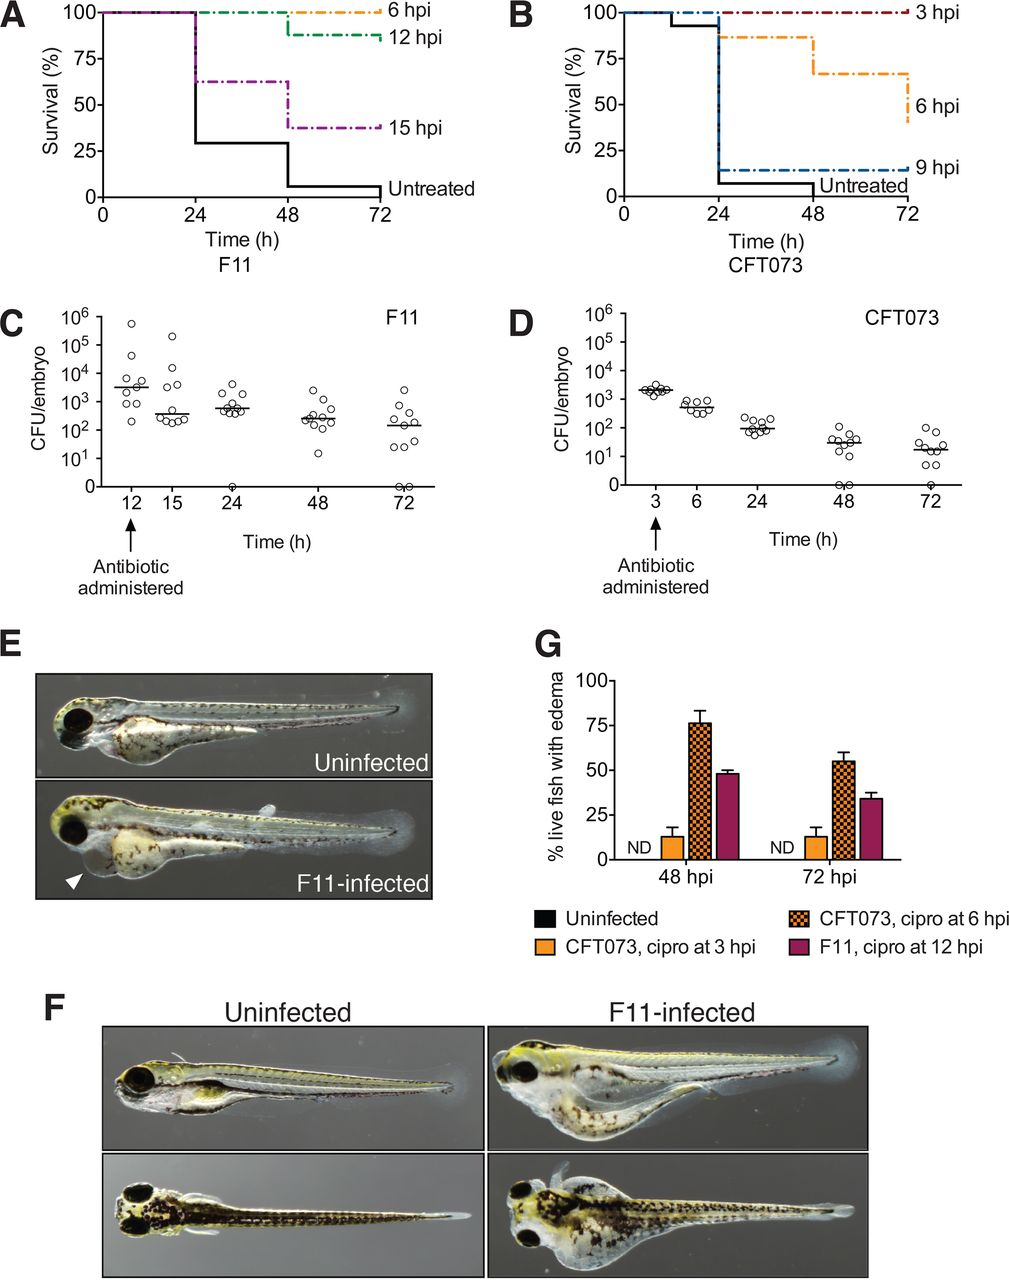
Fig. 3
Survival of ExPEC-infected embryos varies with ciprofloxacin treatment. (A and B) Kaplan-Meier survival curves of zebrafish embryos injected via the circulation valley with F11 (A) or CFT073 (B) and then treated with ciprofloxacin at the times indicated; n = 15 to 20 embryos. Black solid lines show untreated controls. (C and D) Bacterial titers recovered from F11 (C)- and CFT073 (D)-infected embryos before and after treatment with ciprofloxacin at 12 or 3 hpi, as indicated. Bars denote the median values of the groups; n ≥9 embryos pooled from two independent experiments. (E and F) Uninfected controls and F11-infected embryos at 24 (E) and 72 (F) hpi. Both control and F11-infected zebrafish were treated with ciprofloxacin beginning at 12 hpi. The arrowhead in panel E indicates the presence of pericardial edema in a surviving F11-infected embryo. (G) Percentages of surviving embryos with overt signs of edema at 48 and 72 hpi of the bloodstream with F11 or CFT073. Ciprofloxacin was administered at 3, 6, or 12 hpi, as indicated. Uninfected controls were treated with ciprofloxacin at the same time points. Bars represent mean data ± the standard error of the mean from two independent experiments; total n = 30 to 40 fish. ND, not detected.