
Fig. 2
- ID
- ZDB-IMAGE-160726-2
- Genes
- Publication
- Heckel et al., 2015 - Oscillatory Flow Modulates Mechanosensitive klf2a Expression through trpv4 and trpp2 during Heart Valve Development
- All Figures
- Figures for Heckel et al., 2015
|
Fig. 2
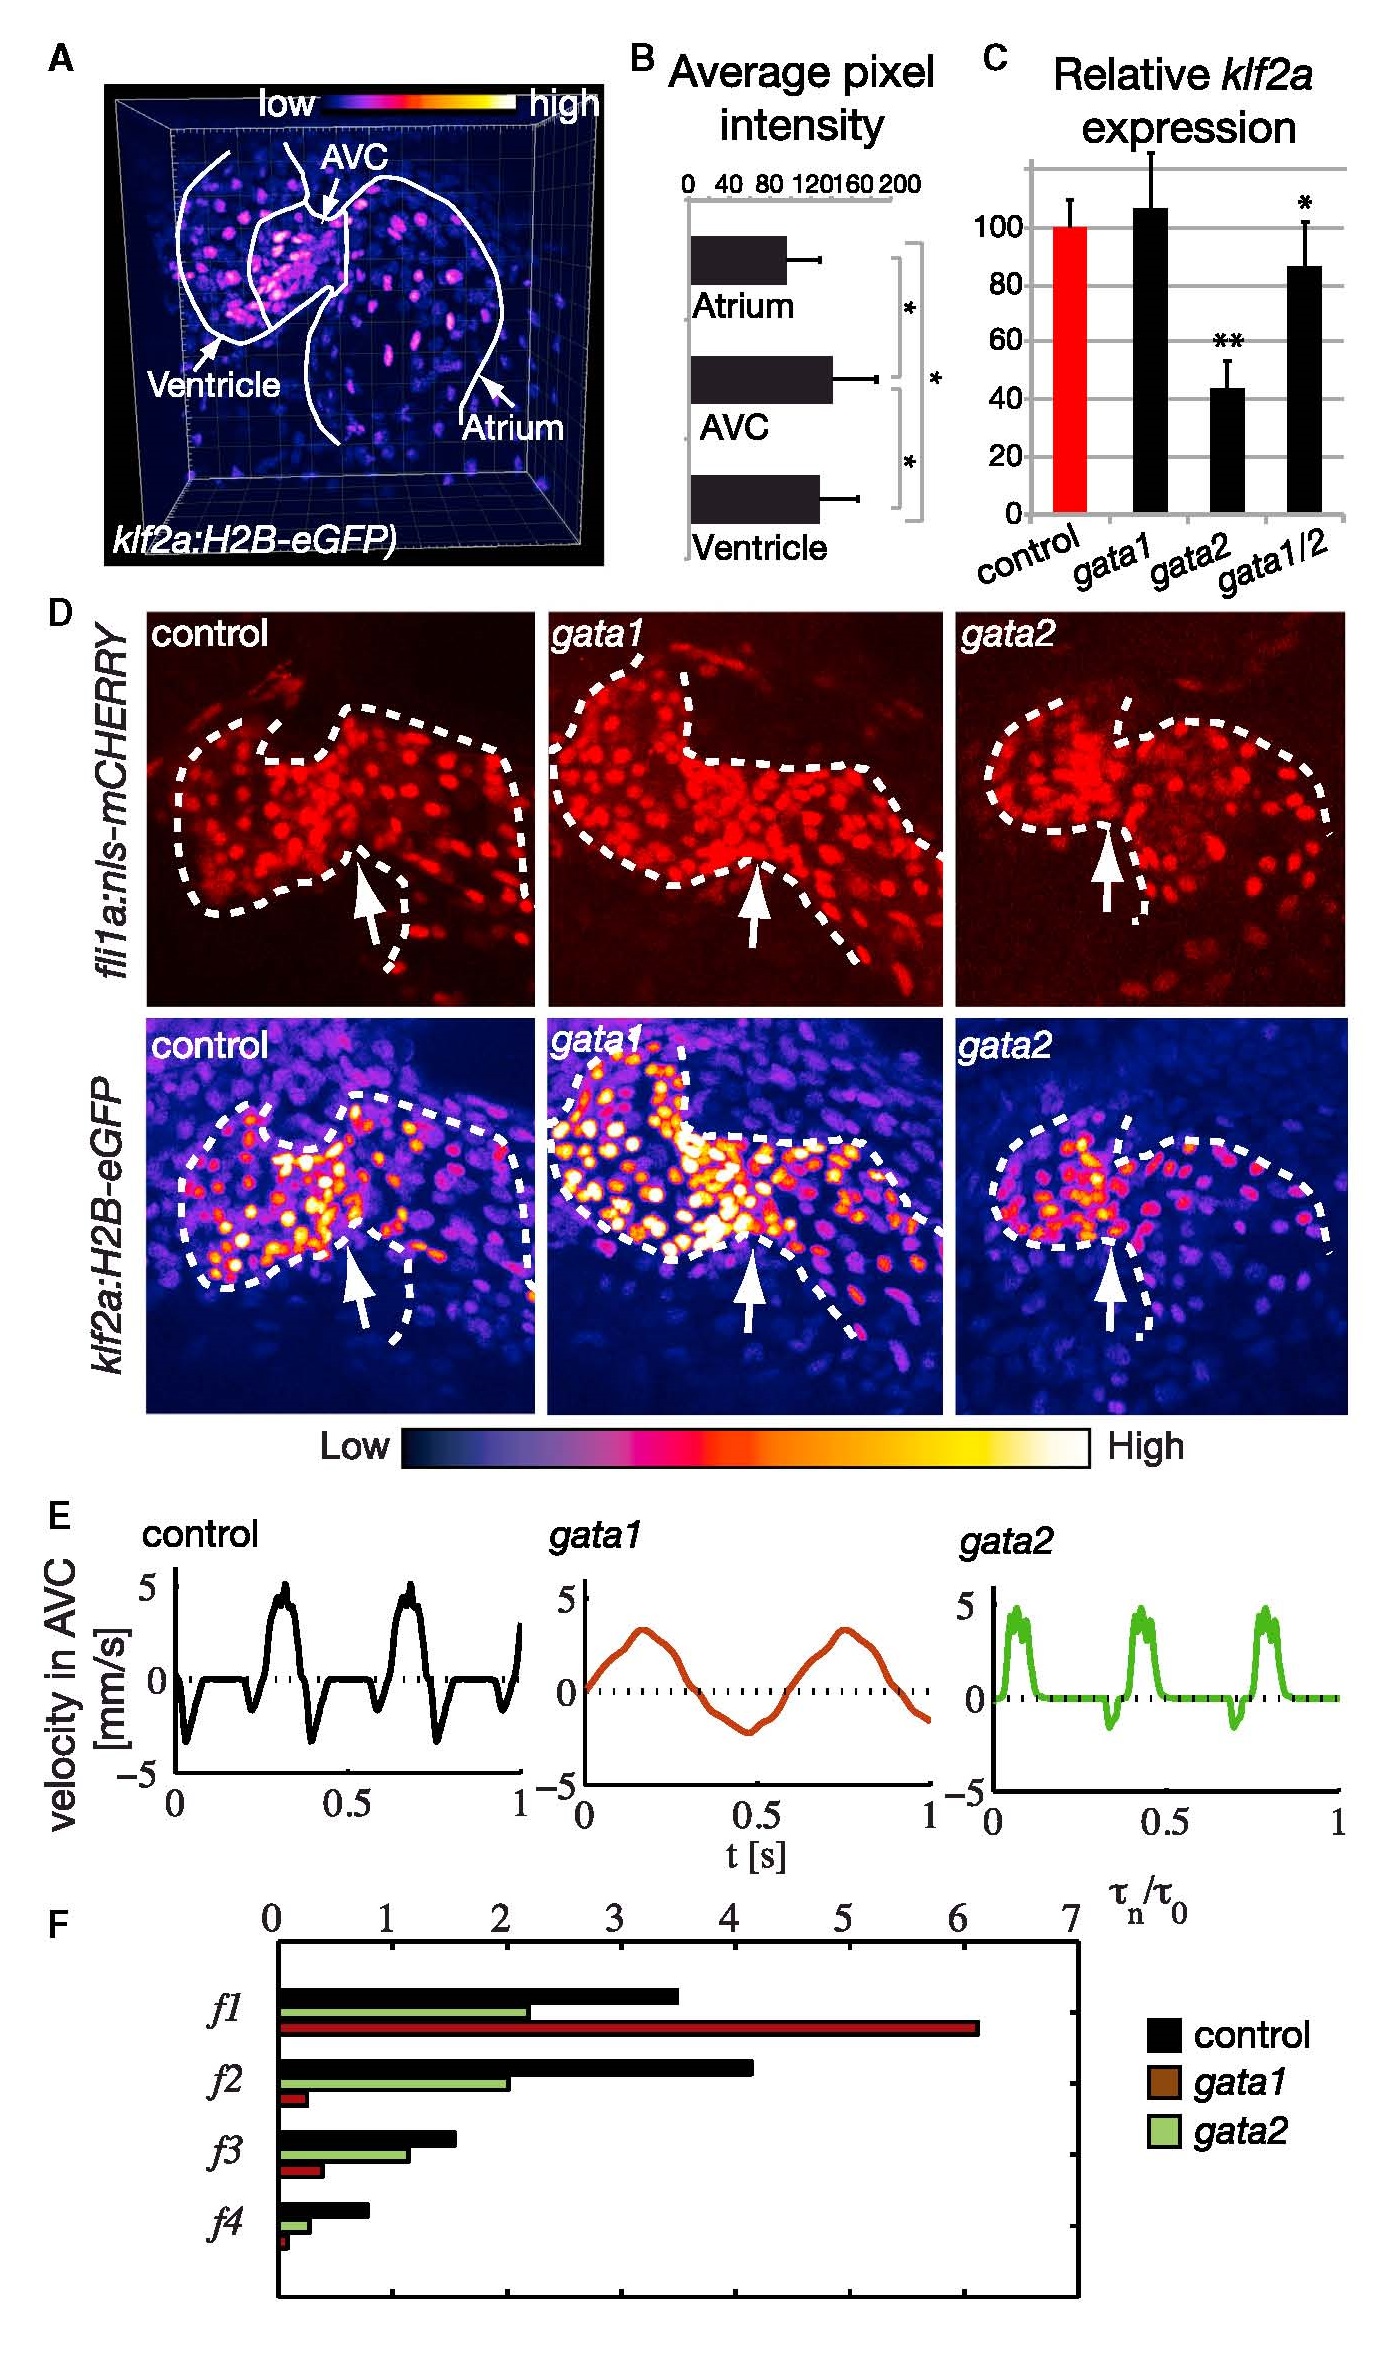
The Oscillatory Flow Amplitude Dictates klf2a Expression Level
(A) klf2a expression pattern in the Tg(klf2a:H2B-eGFP) line.
(B) Relative fluorescence level of the klf2a transgene in the atrium, AVC, and ventricle at 48 hpf. Error bars indicate the SD.
(C) Relative expression level of Tg(klf2a:H2B-eGFP) in gata1 (n = 7), gata2 (n = 6), and gata1/gata2 (n = 5) morphants in the AVC, at 48 hpf. **p < 0.01 ANOVA. Error bars indicate the SD.
(D) Maximum projection images of Tg(fli1a:nls-mcherry) and Tg(klf2a:H2B-eGFP) hearts from control, gata1, and gata2 knockdown embryos. The white arrow points to the AVC. The GFP signal is shown as FireLUT to aid visualization of low signal intensity. The intensity scale is shown below the panels.
(E) Typical flow profiles (velocity magnitude against time) measured in the AVC of control and gata2 and gata1 knockdown hearts at 48 hpf. Negative values denote flow reversal from the ventricle to the atrium.
(F) Amplitude of the harmonic index τn/τ0 for the flow profile in (E), with τn the amplitude of the frequency harmonic f = nf1, f1 the fundamental frequency, and τ0 the average shear stress.
See also Figures S1 and S2 and Movie S3.