
IMAGE
Fig. 6
- ID
- ZDB-IMAGE-160726-14
- Publication
- Housley et al., 2016 - Cavin4b/Murcb Is Required for Skeletal Muscle Development and Function in Zebrafish
- All Figures
- Figures for Housley et al., 2016
Image
|
Figure Caption
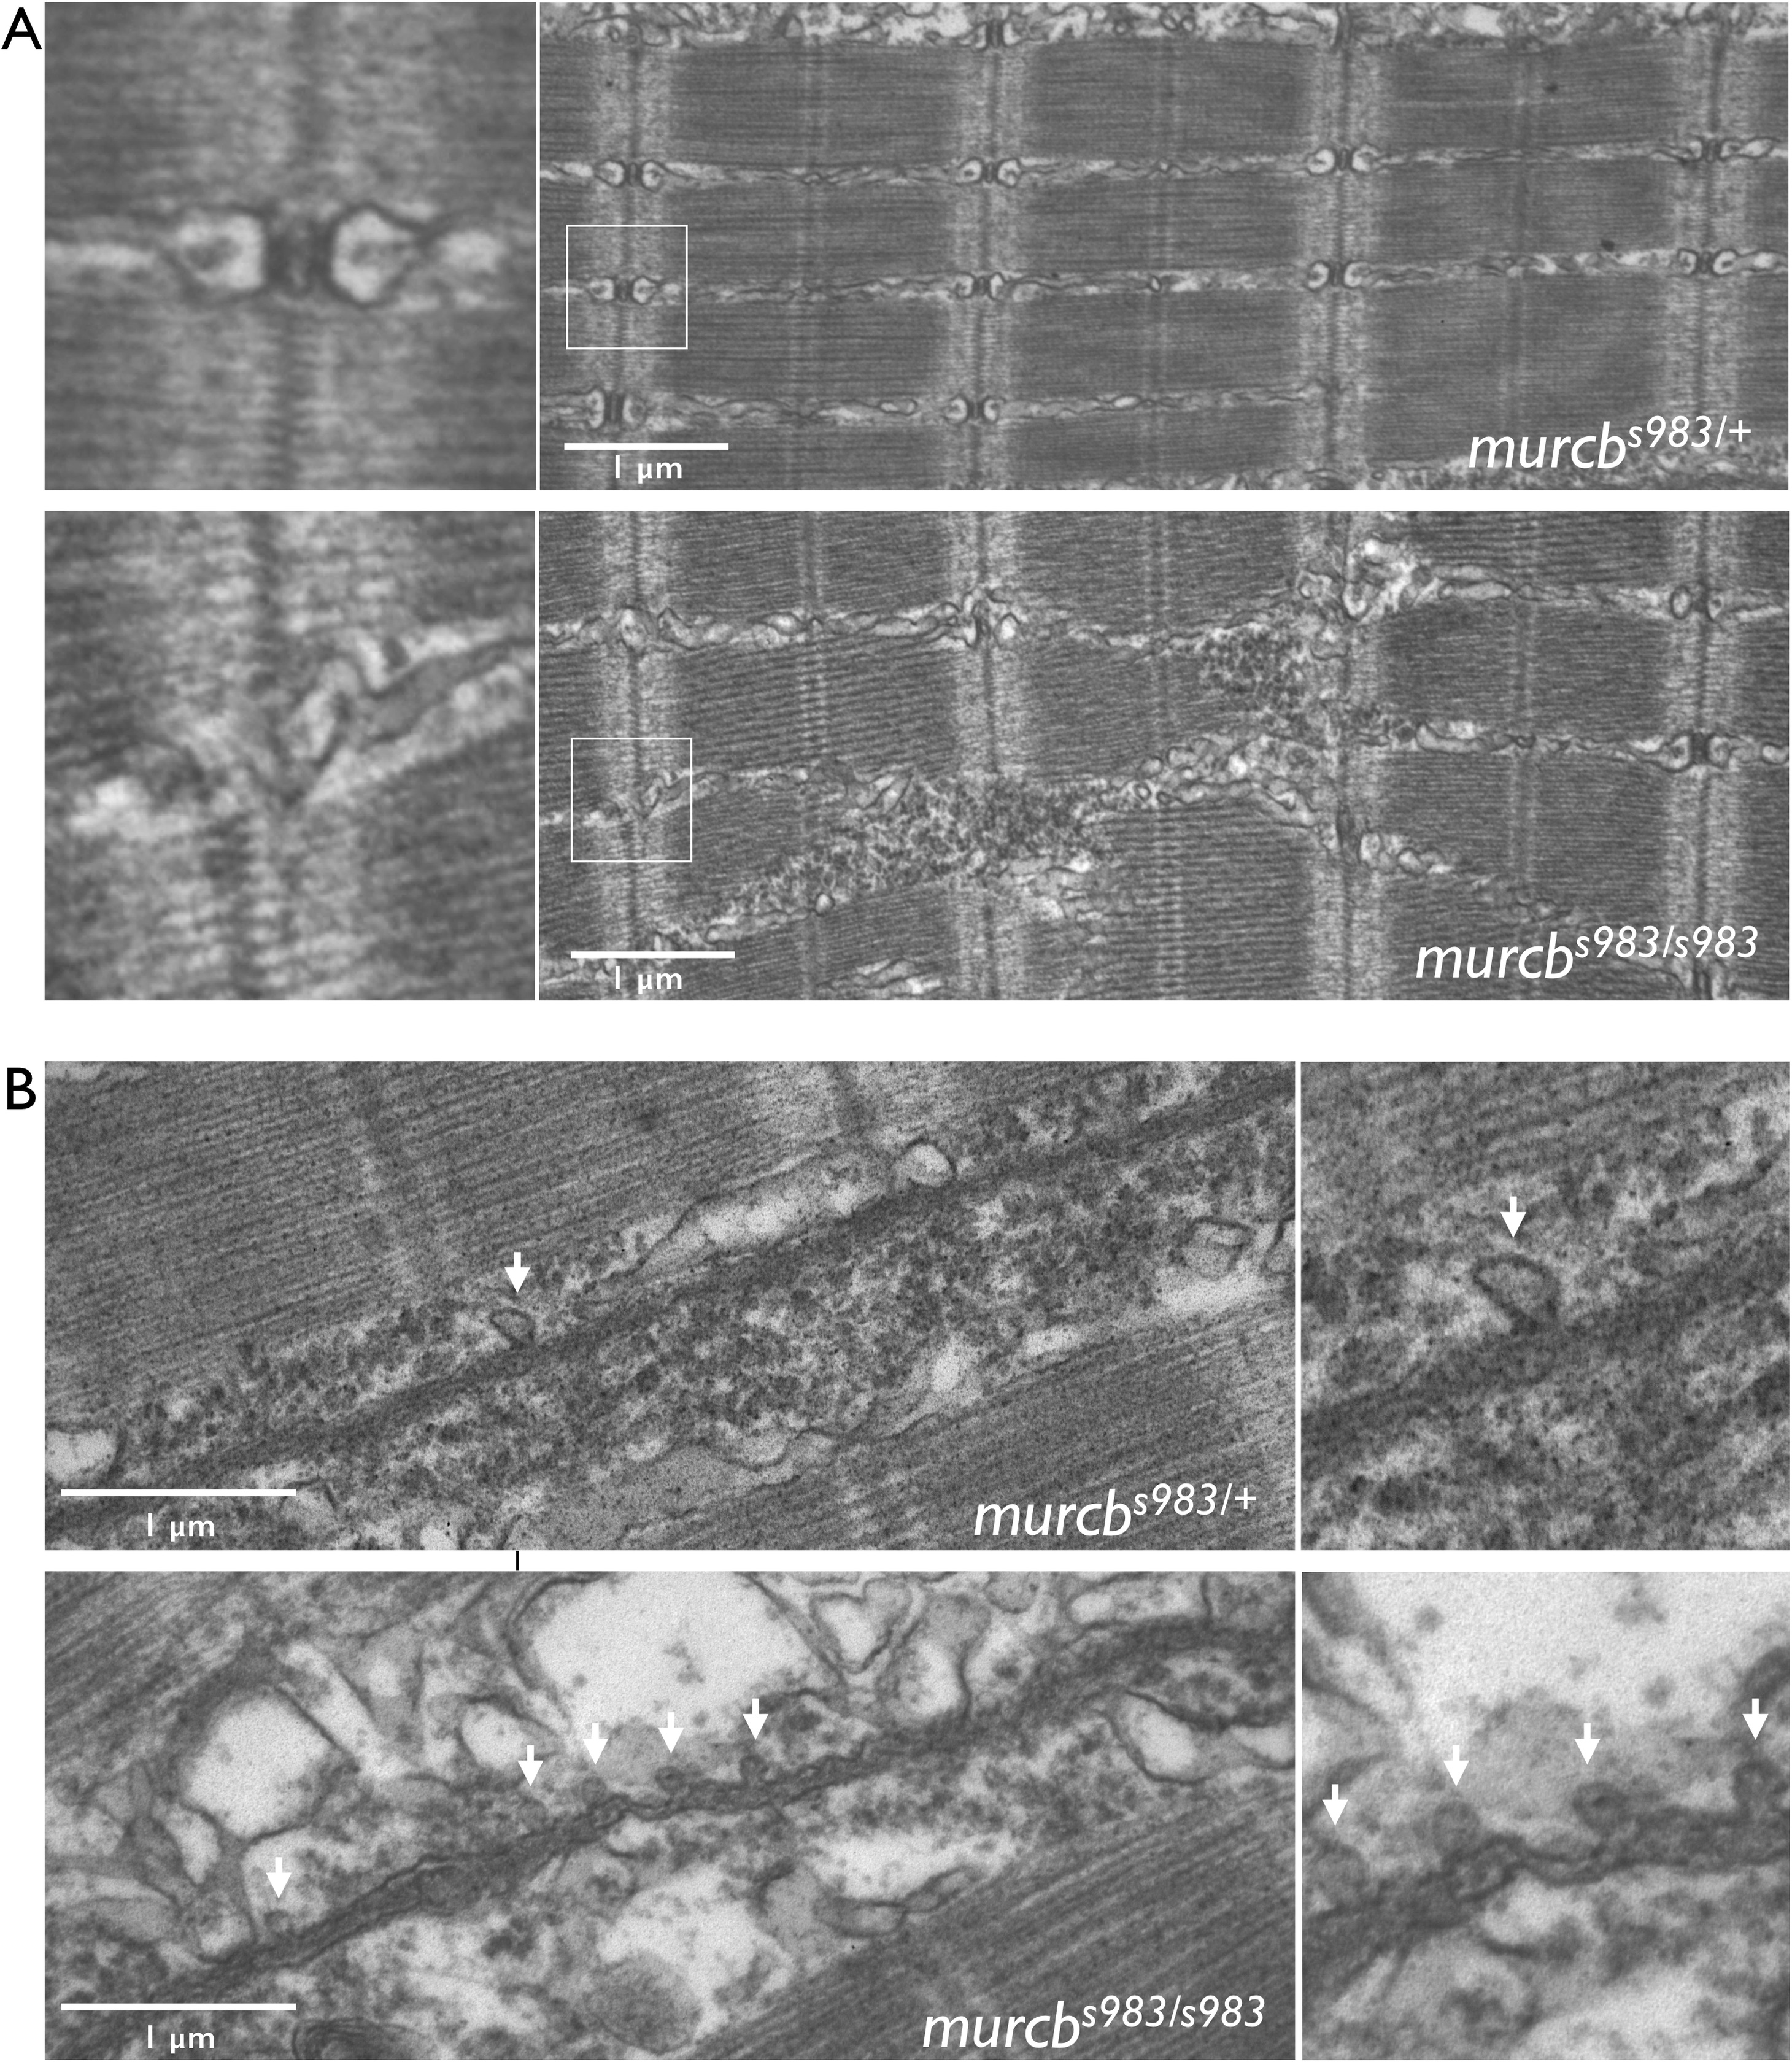
Fig. 6
Ultra-structural analysis of Cavin4b/Murcb deficient skeletal muscle. A. Representative electron micrographs of murcbs983/+ and murcbs983/s983 zebrafish at 80 hpf. T-tubule triad structures are indicated with a box and enlargements of this region are shown on the left. B. Representative electron micrographs of murcbs983/+ and murcbs983/s983 zebrafish at 80 hpf. Caveloae are indicated by arrows. Enlargements from the micrographs are shown on the right.
Figure Data
Acknowledgments
This image is the copyrighted work of the attributed author or publisher, and
ZFIN has permission only to display this image to its users.
Additional permissions should be obtained from the applicable author or publisher of the image.
Full text @ PLoS Genet.