
Fig. 6
- ID
- ZDB-IMAGE-160715-19
- Publication
- Paul et al., 2016 - Ihha induces hybrid cartilage-bone cells during zebrafish jawbone regeneration
- All Figures
- Figures for Paul et al., 2016
|
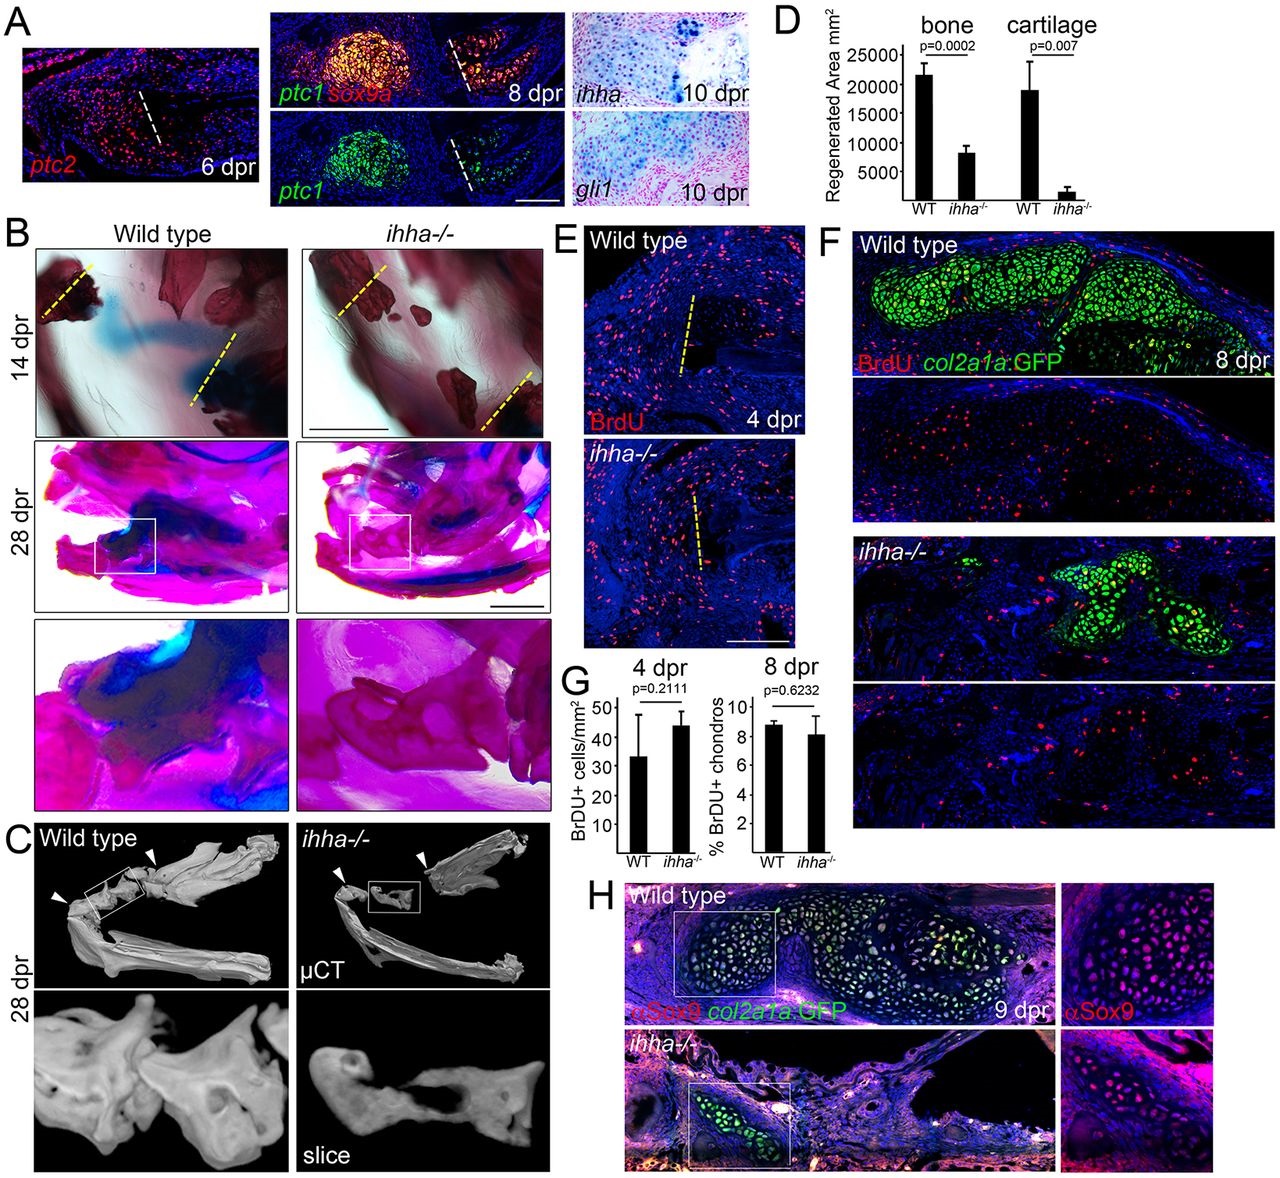
Fig. 6
Requirement of ihha in the generation of repair cartilage. (A) In situ hybridization of the regenerating jawbone shows mesenchymal expression of ptc2 at 6dpr, co-expression of sox9a and ptc1 in the cartilage callus at 8dpr, and ihha and gli1 in the callus at 10dpr. Dashed lines show resection sites. (B) Compared with size-matched wild-type siblings, ihha-/- adults show a lack of cartilage at 14dpr. Whereas the wild type bridges the resection site with thick bone by 28dpr, ihha-/- mutants have reduced and hollow bone. (C) Bone µCT shows reduced mineralization within the repair region (arrowheads). Top images are ventral views of the lower jaw and boxes show magnified images below. See also Movies 2 and 3. (D) Quantification of the area of repair bone and cartilage in the wild type and ihha mutants at 28dpr. A Student′s t-test showed statistical differences between groups. Standard errors of the mean are shown. (E) ihha mutants and their wild-type siblings have similar numbers of BrdU+ cells in the resected regions (left of the dashed lines). (F) BrdU incorporation (red) and col2a1aBAC:GFP labeling of chondrocytes (green, detected by anti-GFP antibody) shows reduced cartilage but similar proliferation rates in ihha mutants. (G) Quantification of labeled BrdU+ nuclei in wild type and mutants. A Student′s t-test showed no statistical differences at either stage. (H) Antibody staining in wild type and ihha mutants carrying the col2a1aBAC:GFP transgene shows fewer chondrocytes expressing Sox9 (red) and GFP (green) in mutants versus siblings. Insets show that the few cartilage cells that form in mutants express Sox9 protein. Hoechst labels nuclei in blue. Scale bars: 1mm in B and 100µm in A,E.