
Fig. 2
- ID
- ZDB-IMAGE-160713-36
- Publication
- Hoffman et al., 2016 - Estrogens Suppress a Behavioral Phenotype in Zebrafish Mutants of the Autism Risk Gene, CNTNAP2
- All Figures
- Figures for Hoffman et al., 2016
|
Fig. 2
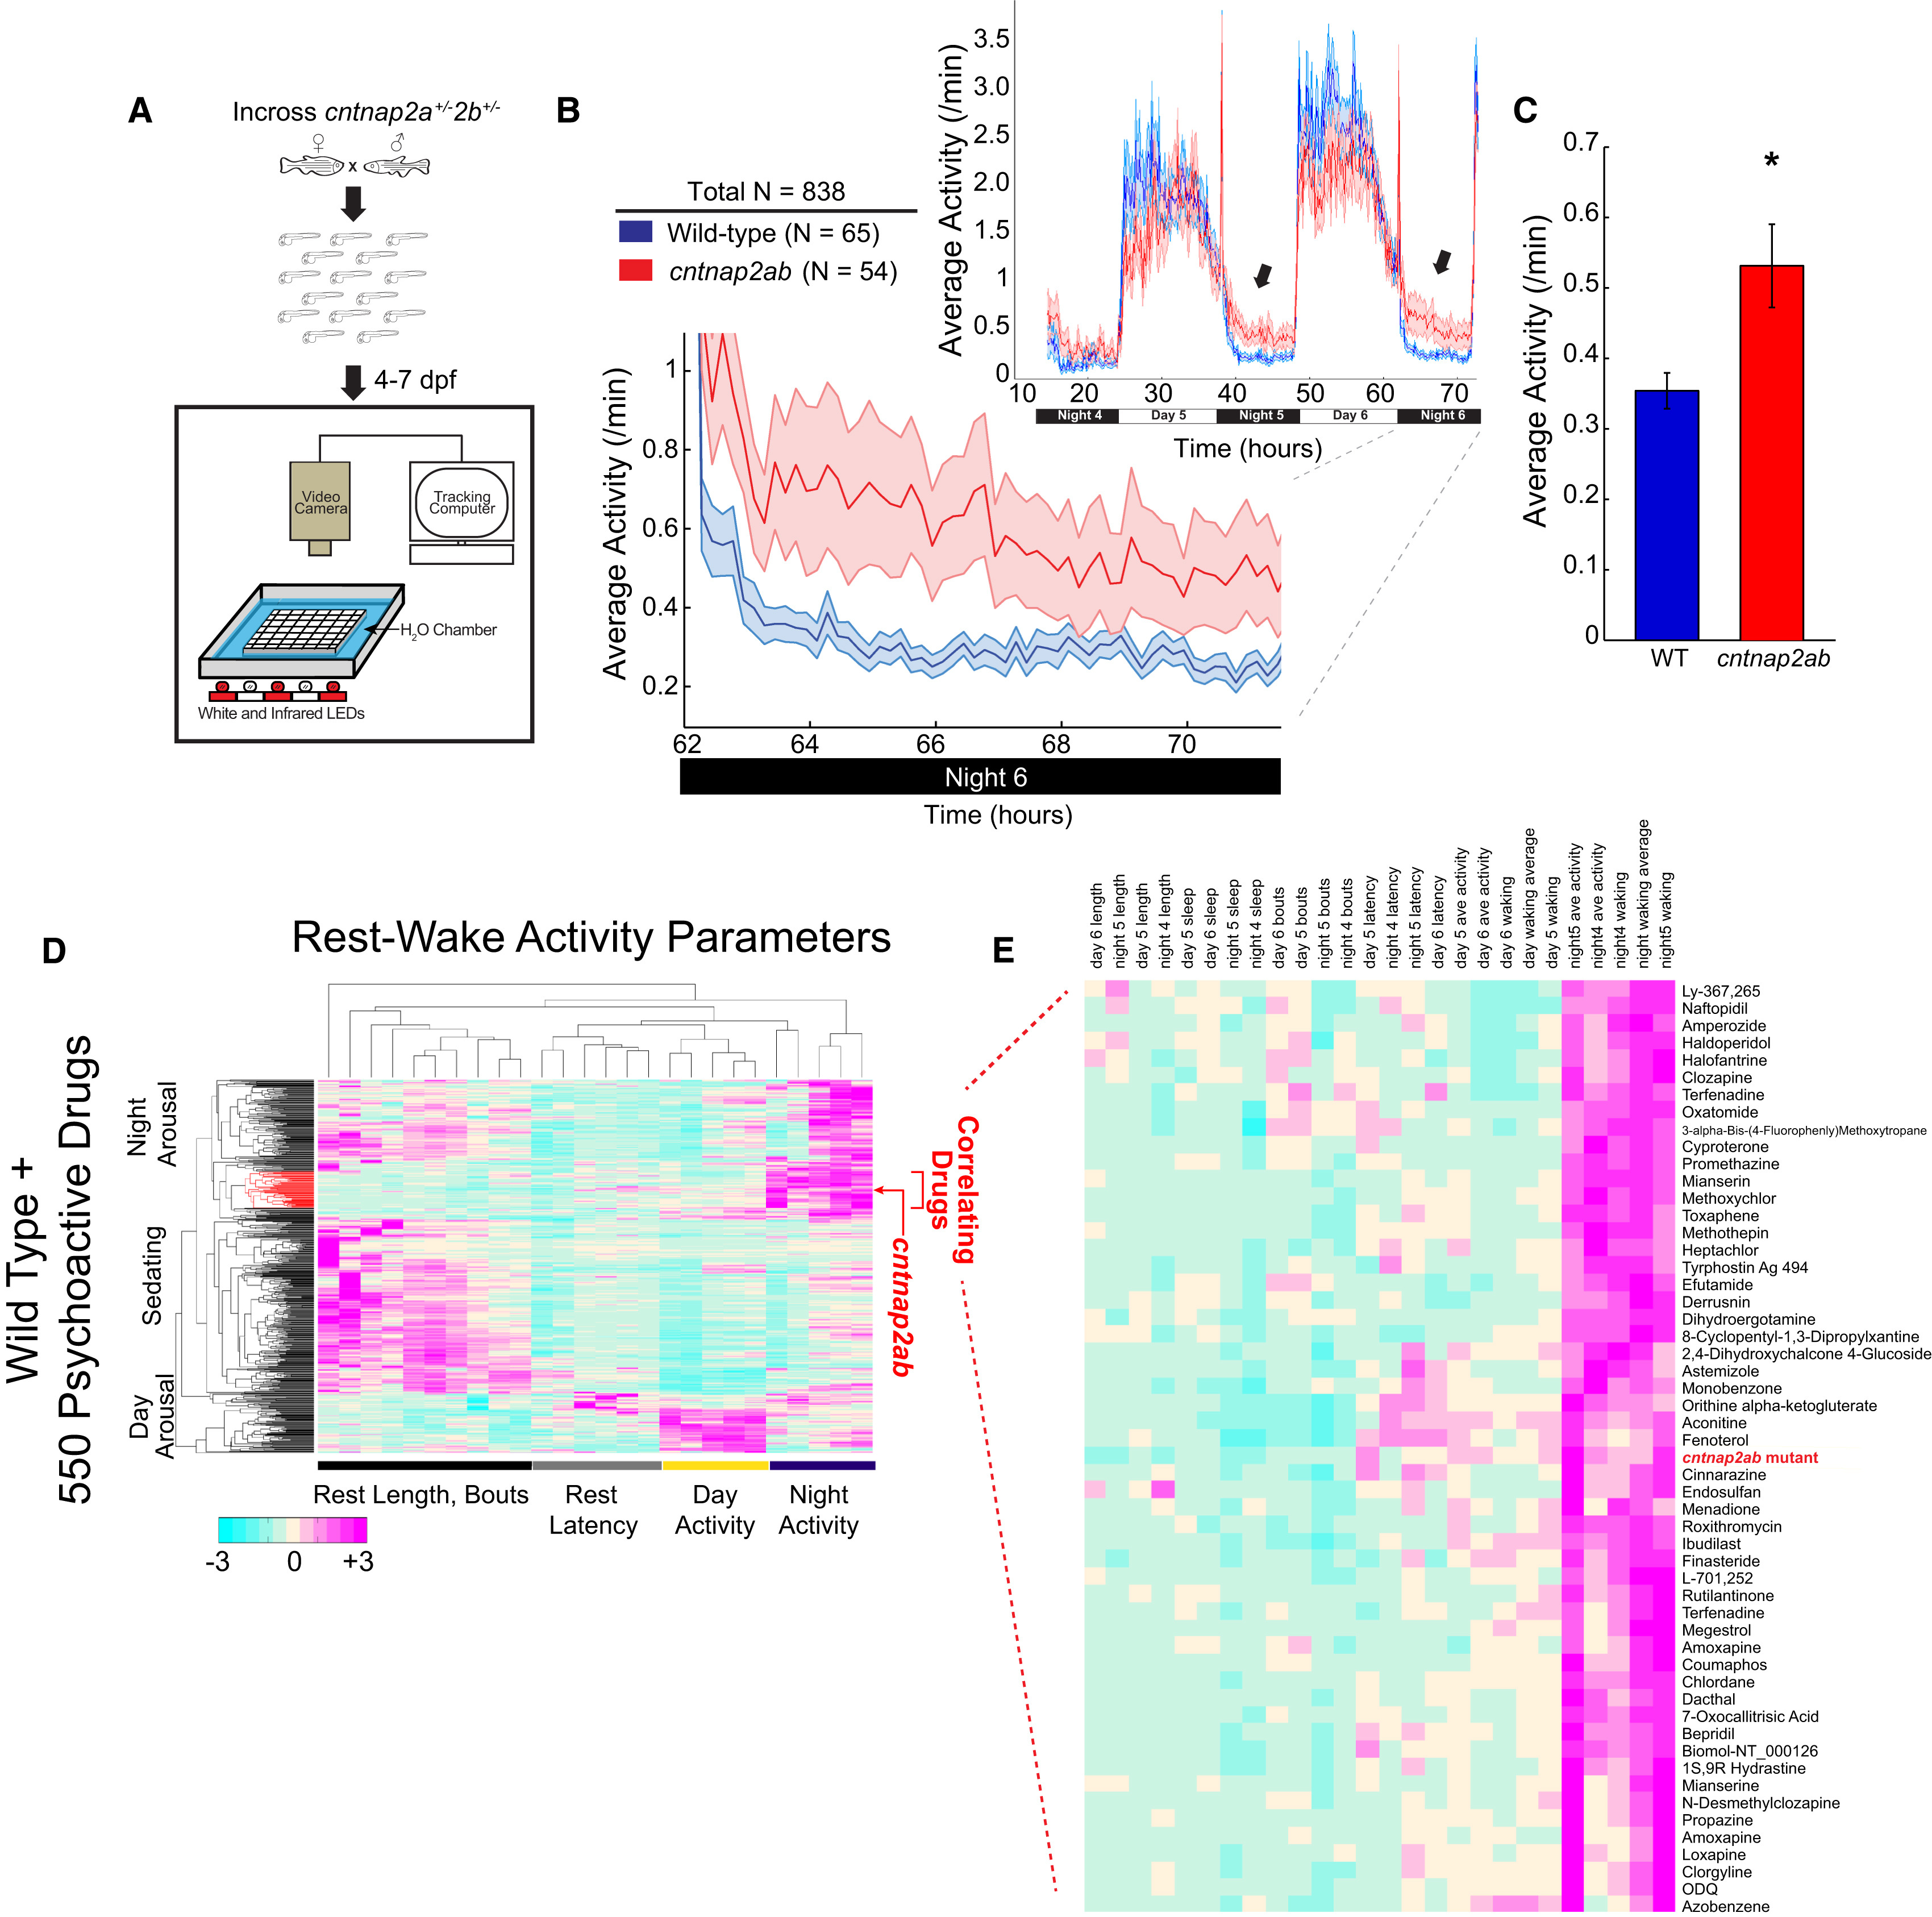
cntnap2ab Mutants Display Nighttime Hyperactivity
(A) Experimental setup (Prober et al., 2006 and Rihel et al., 2010).
(B) Locomotor activity of cntnap2aΔ25/Δ25cntnap2bΔ7/Δ7 (cntnap2ab, red) and wild-type (WT; blue) sibling-matched larvae over 72 hr. Hyperactivity in mutants worsens on successive nights (arrows). The magnified activity profile on night 6 is shown.
(C) Average locomotor activity of cntnap2ab versus wild-type. p = 0.00012 (one-way ANOVA, comparing all genotypes on all nights); p = 0.0193, 0.0236, and 0.0073, nights 4, 5, and 6, respectively.
(D) Hierarchical clustering of the cntnap2ab behavioral fingerprint (red arrow) compared with the fingerprints of wild-type larvae exposed to a panel of 550 psychoactive agents from 4–6 dpf ( Rihel et al., 2010). Each rectangle in the clustergram represents the Z score, or the average value in SDs relative to the behavioral profiles of wild-type exposed to DMSO alone (magenta, higher than DMSO; cyan, lower than DMSO). The cntnap2ab profile correlates with agents that induce nighttime arousal (“Correlating Drugs”).
(E) A magnified section of the clustergram, highlighting compounds that correlate with the cntnap2ab mutant behavioral fingerprint.