
|
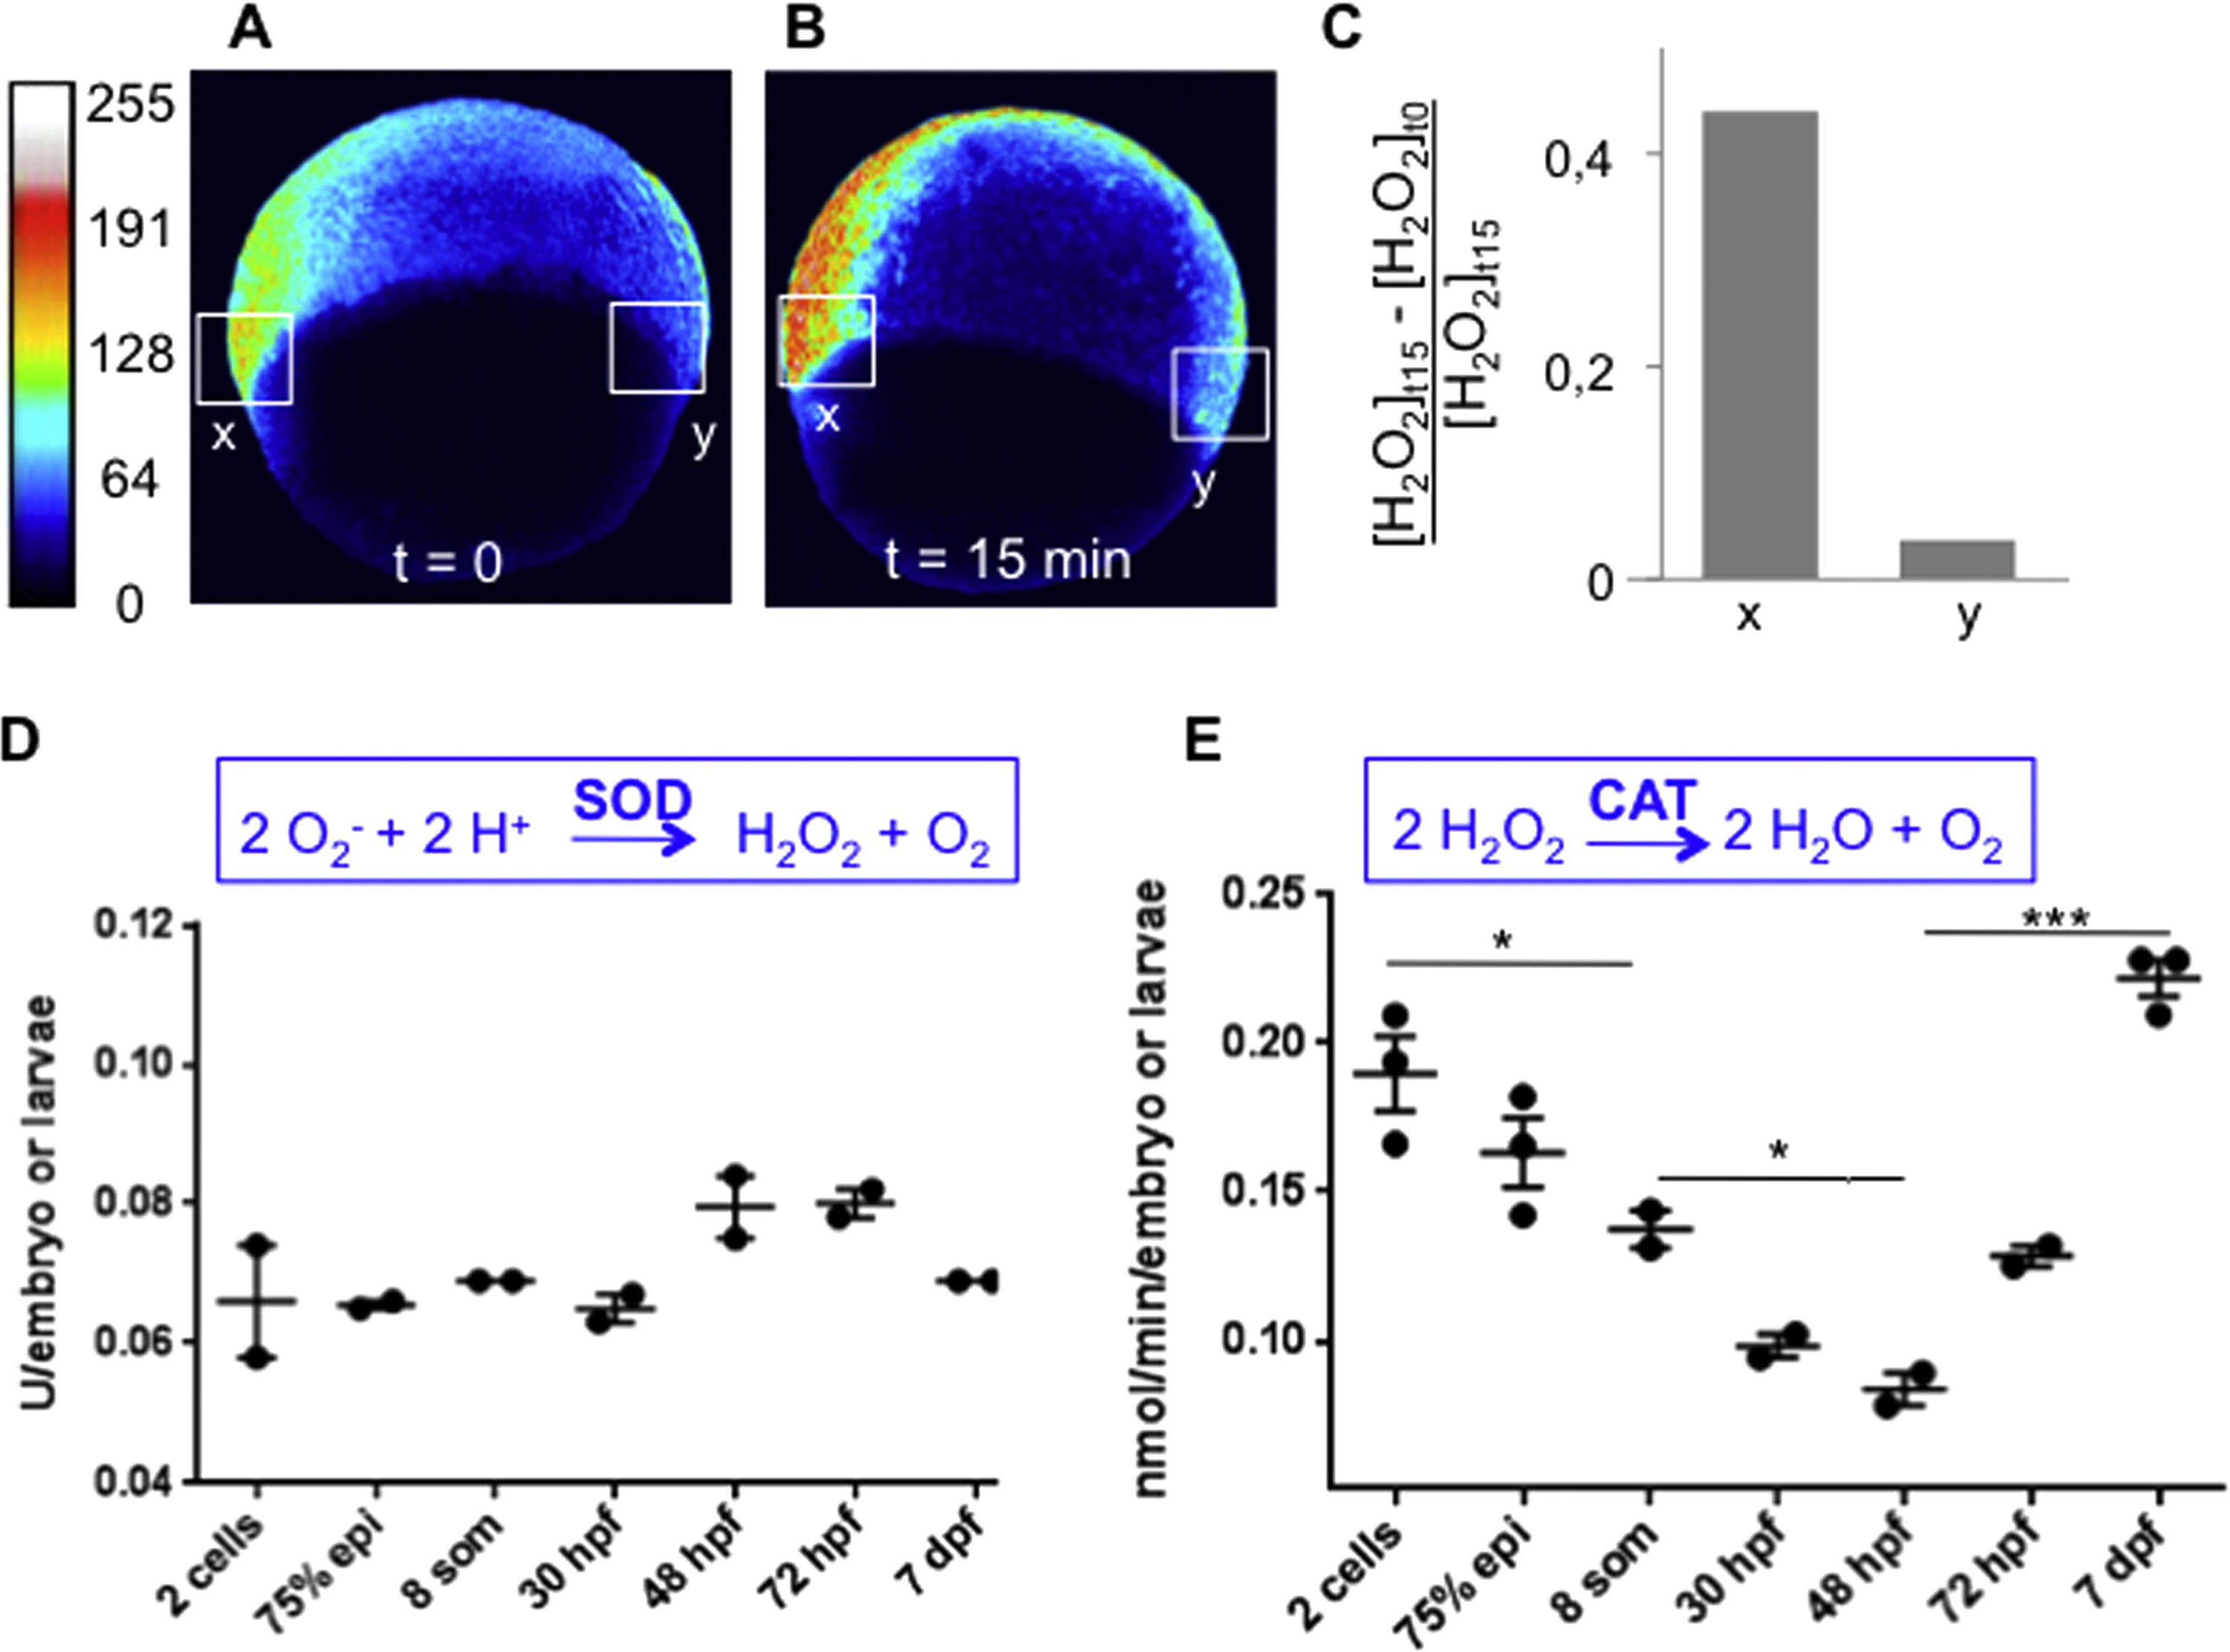
Fig. 2
The H2O2 levels are regulated at the degradation step. (A-C) HyPer imaging during gastrulation. The embryos were incubated in 1 mM H2O2 and the HyPer signal was measured prior to incubation and 15 min after the addition of H2O2. Exogenous H2O2 enhanced the H2O2 signal in the tissues with high endogenous H2O2 levels (region x), but has a minimal, if any, effect on cells without H2O2 (region y). n=3; representative lateral views are shown. (D) Superoxide dismutase (SOD) activity (E) and Catalase (CAT) activity during development. Legends: 75% epi=gastrulation, 8 som=somitogenesis. The error bars represent the standard error of the mean (SEM) (*p<0.05; ***p<0.001).
Reprinted from Developmental Biology, 414(2), Gauron, C., Meda, F., Dupont, E., Albadri, S., Quenech'Du, N., Ipendey, E., Volovitch, M., Del Bene, F., Joliot, A., Rampon, C., Vriz, S., Hydrogen peroxide (H2O2) controls axon pathfinding during zebrafish development, 133-41, Copyright (2016) with permission from Elsevier. Full text @ Dev. Biol.