
|
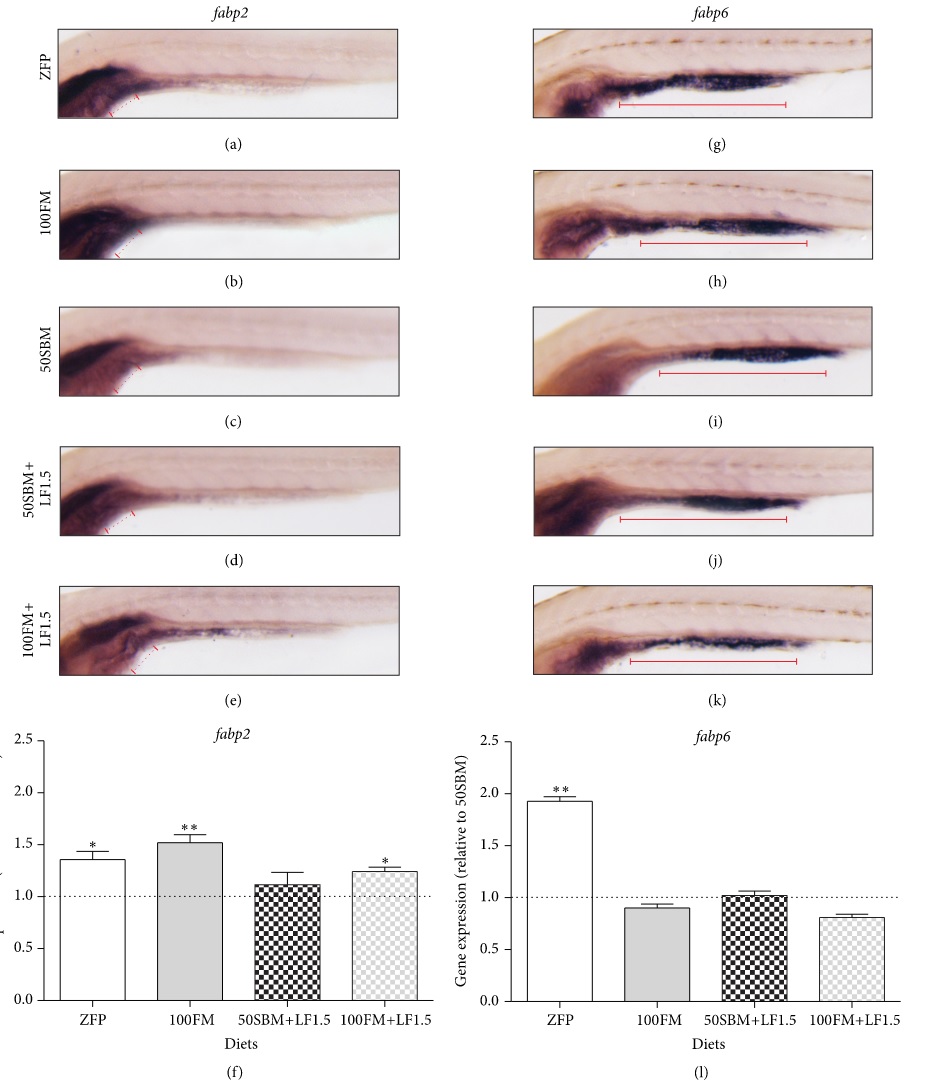
Fig. 3
Effect of lactoferrin on lipid absorption markers. (a-e) fabp2 and (g-k) fabp6 mRNA expression pattern was analyzed by whole-mount in situ hybridization. Lateral view of larvae of 9 dpf after four days of feeding with different diets (ZFP, 100FM, 50SBM, 50SBM+LF1.5, and 100FM+LF1.5). (a-e) fabp2 expression was restricted to anterior intestine (red dotted line). (g-k) fabp6 expression was observed in the whole intestine, with a stronger expression in the mid and posterior gut (red continued line). (f and l) The transcriptional levels of fabp2 and fabp6 were quantified by qPCR. Data were normalized with β-actin and rpl13α and compared to 50SBM diet (dotted line). *P < 0.05; **P < 0.01.