
|
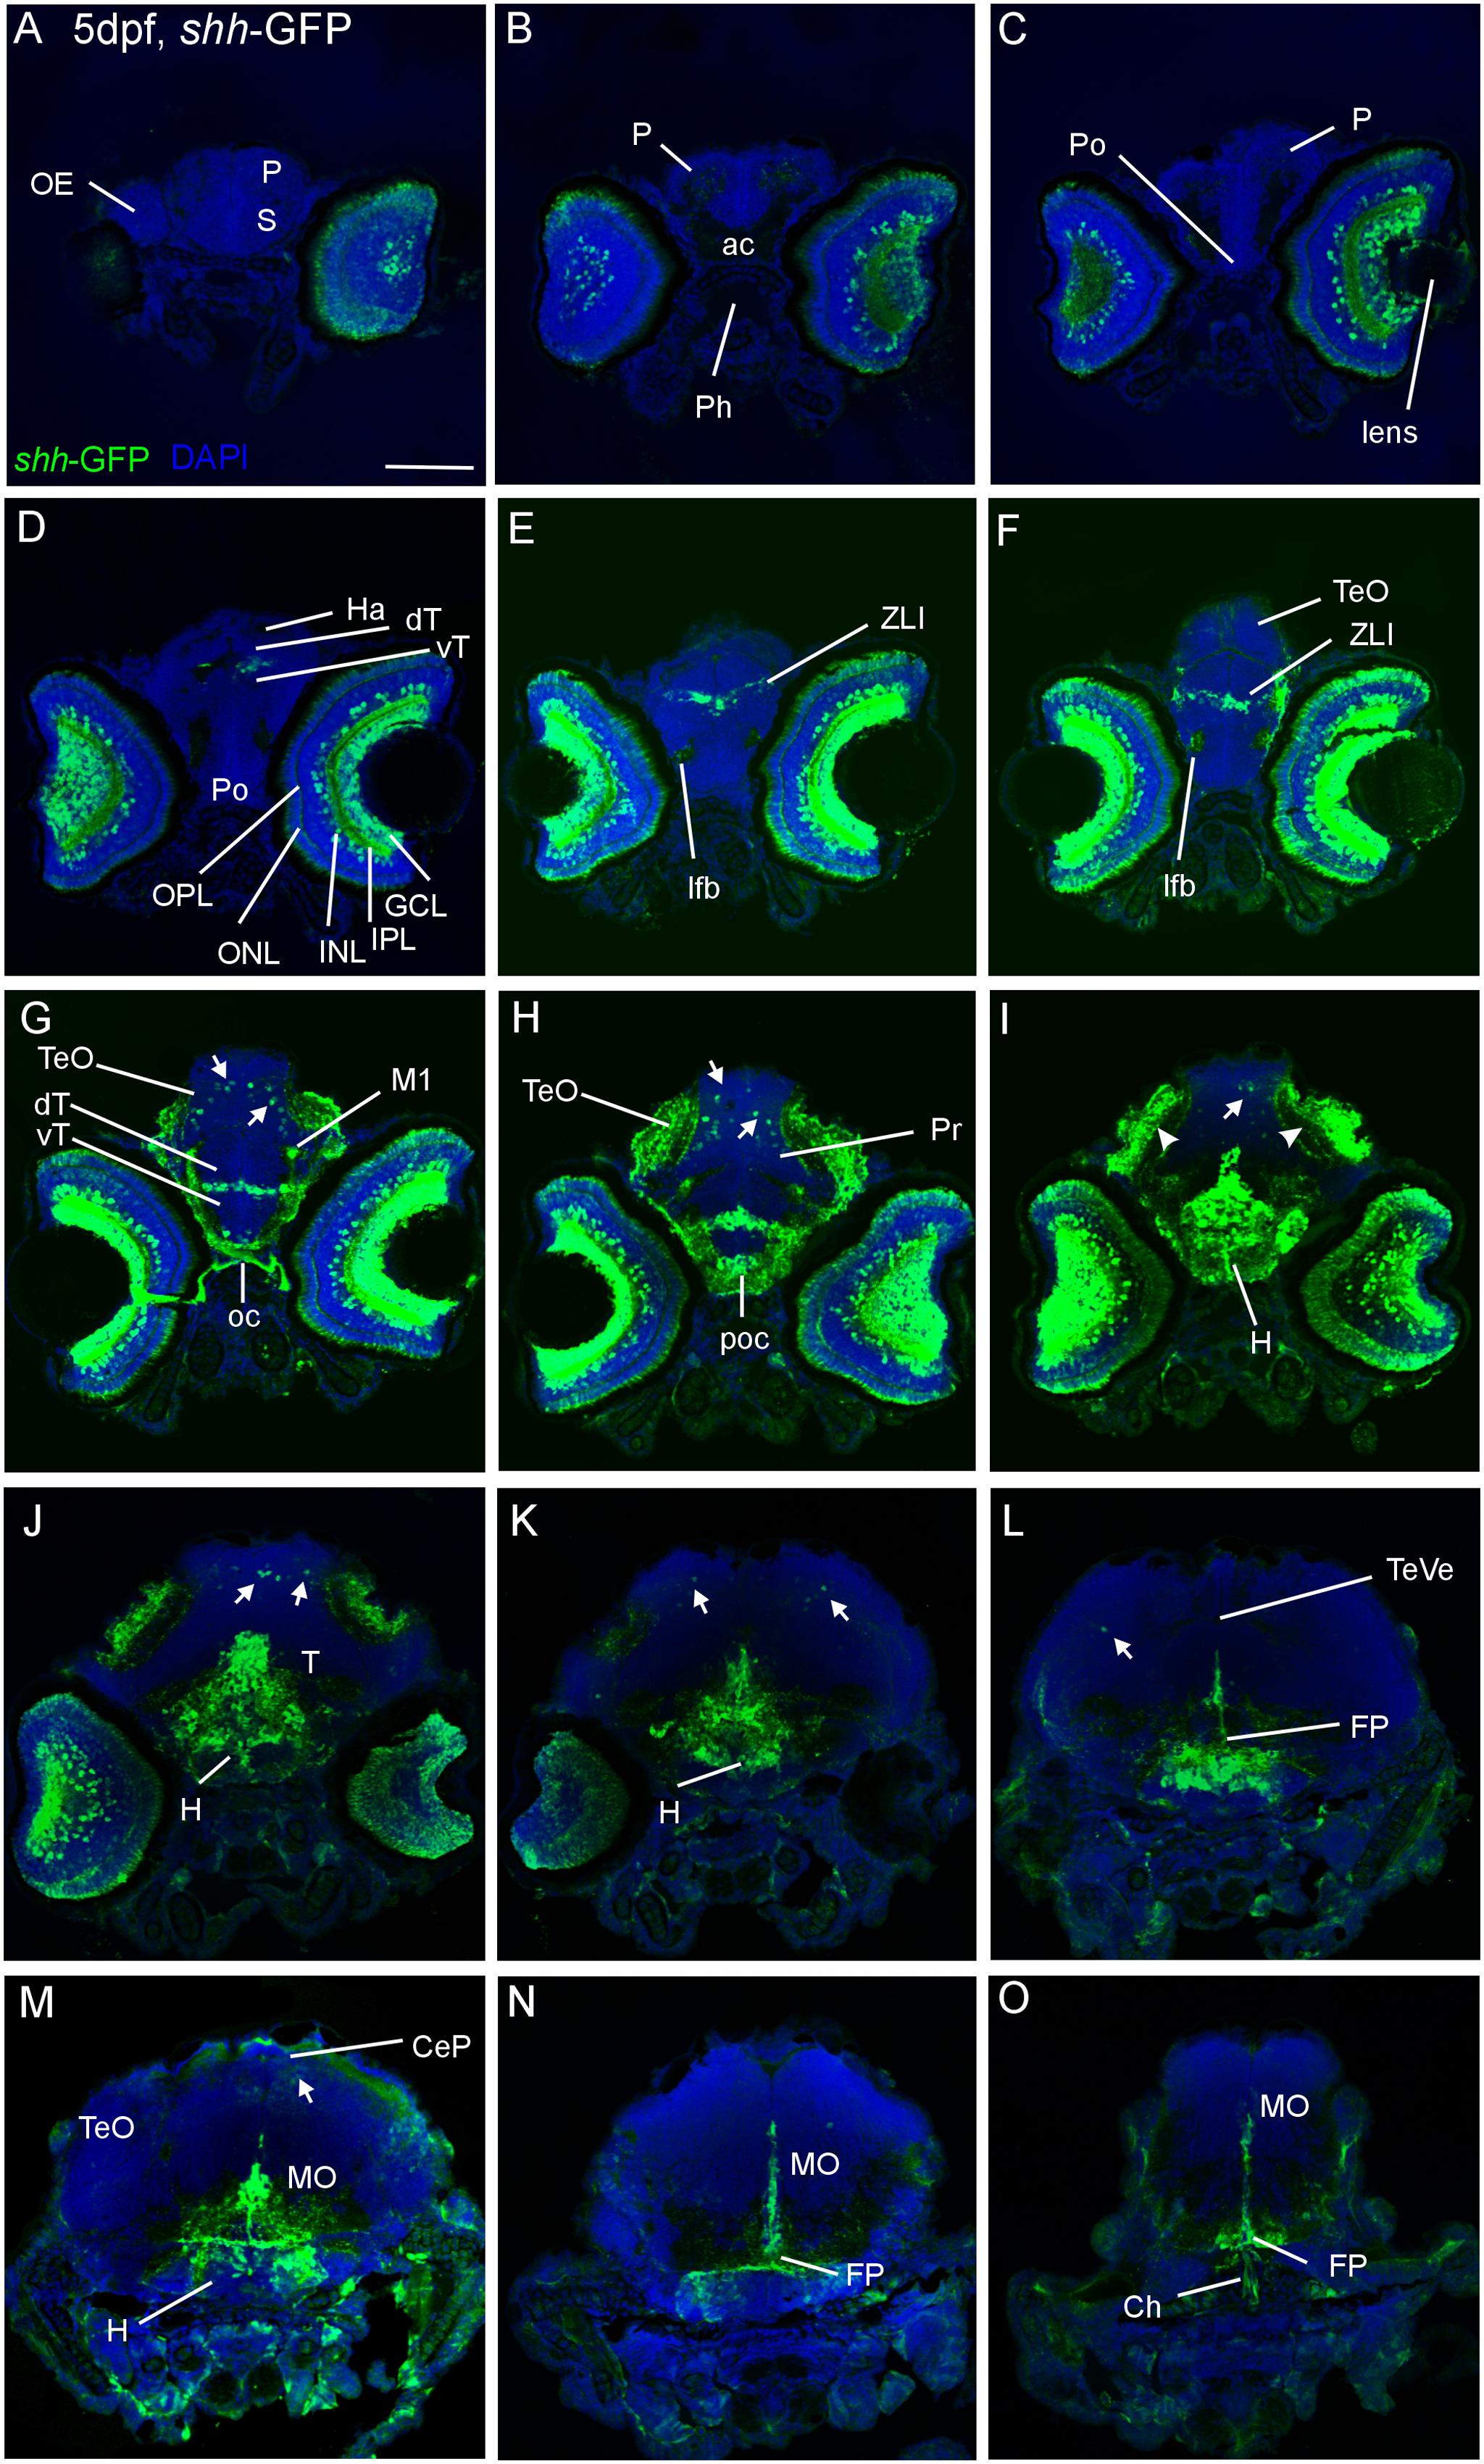
Fig. 1
Confocal photomicrographs (maximum projections) of transverse sections of a shh-GFP zebrafish larva at 5 dpf immunostained for GFP (with DAPI as counterstain) show levels from telencephalon to medulla oblongata (A-O). Note in particular basal expression in floor plate (J-O), hypothalamus (I-M), and dorsal (alar plate) tectal (G-I) and cerebellar (J-M) GFP-expressing cells (arrows). Arrowheads indicate primary visual projections in optic tectum. See text for more details. Scale bar in (A): 100 µm (applies to all panels). CeP, cerebellar plate; dT, dorsal thalamus; FP, floor plate; GCL, ganglion cell layer; H, hypothalamus; Ha, habenula; INL, inner nuclear layer; IPL, inner plexiform layer; MO, medulla oblongata; oc, optic chiasma; OC, otic capsule; ONL, outer nuclear layer; P, pallium; poc, postoptic commissure; PTd, dorsal part of posterior tuberculum; S, subpallium; T, midbrain tegmentum; TeO, optic tectum; TeVe, tectal ventricle; vT, ventral thalamus (prethalamus); ZLI, zona limitans intrathalamica.