
Fig. 10
- ID
- ZDB-IMAGE-160602-3
- Genes
- Publication
- McCarthy et al., 2016 - Pdgfra and Pdgfrb genetically interact during craniofacial development
- All Figures
- Figures for McCarthy et al., 2016
|
Fig. 10
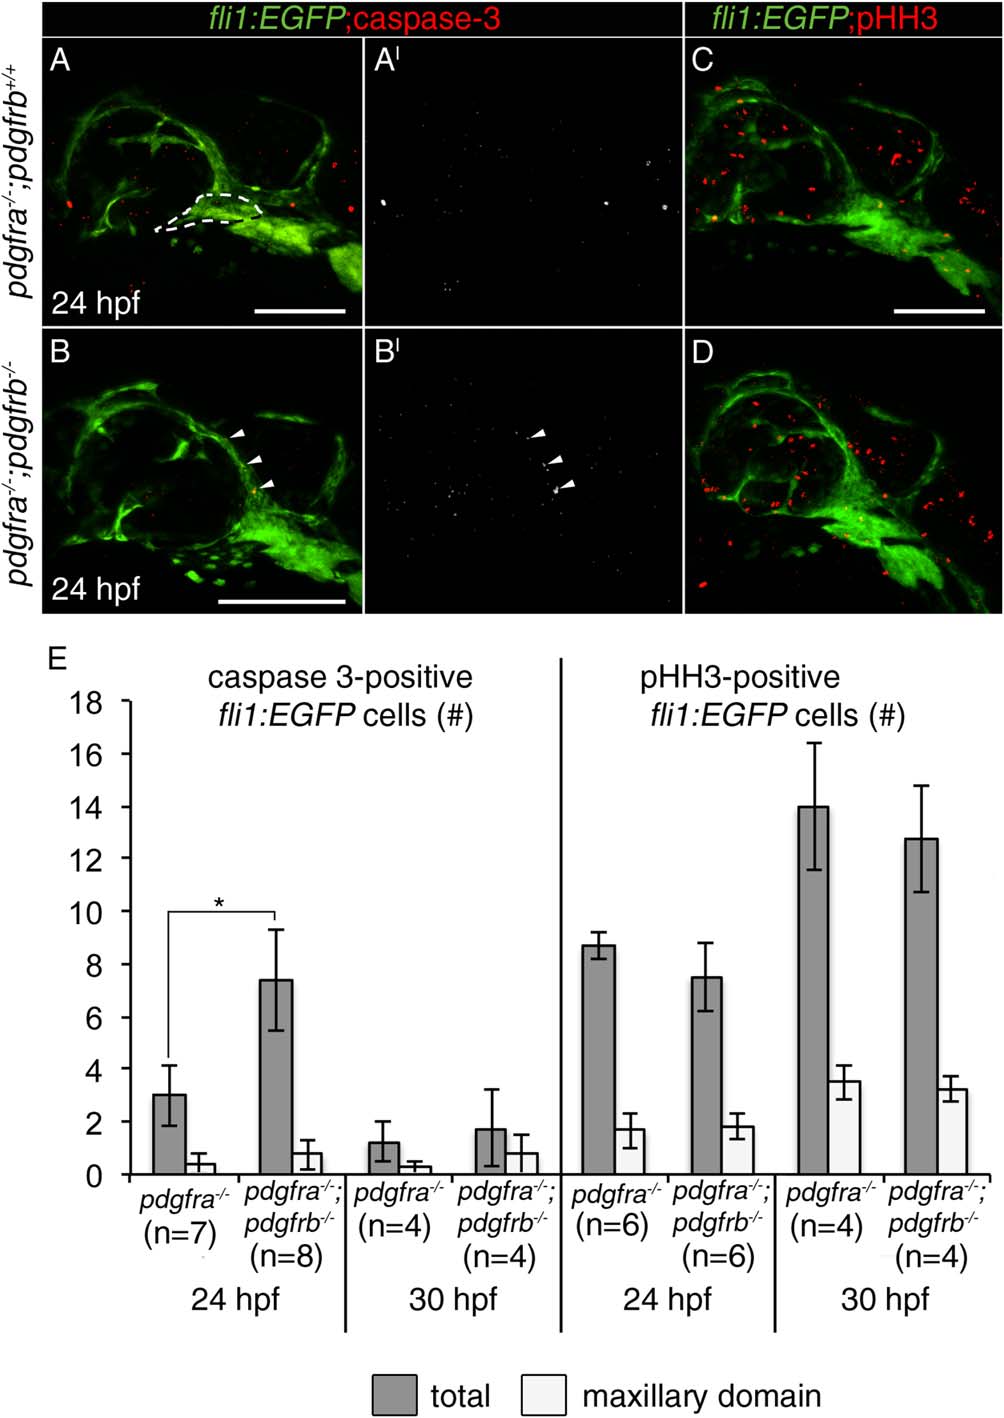
Neither cell death nor proliferation is significantly affected in the maxillary domain of pdgfra;pdgfrb mutants. A-D: The 24 hpf fli1:EGFP zebrafish embryo with corresponding genotypes listed left of panels, stained for active caspase 3 (A and B in red; A′ and B′ in gray), and phospho-histone H3 (pHH3) in (C,D). Anterior is to the left. B–B′: pdgfra-/-;pdgfrb-/- embryos show increased total cell death at 24 hpf, but not in the maxillary domain crest (arrowheads show cell death above the eye, maxillary domain is outlined in panel A). E: Bar chart representing either total (gray bars) or maxillary domain (light bars) number of active caspase 3-positive or pHH3-positive fli1:EGFP cells in corresponding genotypes (Students t-test, P ≤ 0.05). Scale bar = 100 µm.