
Image
|
Figure Caption
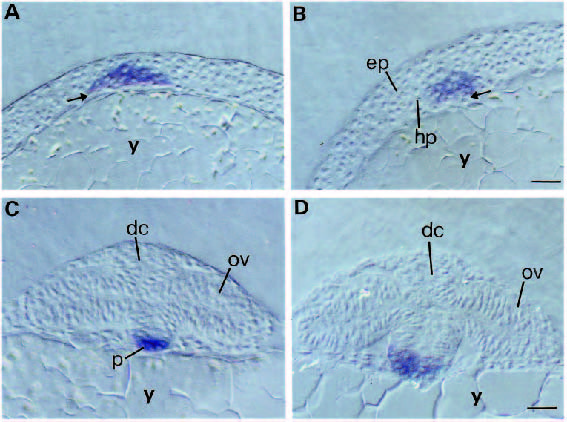
Fig. 3
Analysis of the tissue distribution of hlx-1 transcripts in rostral cross-sections of stained embryos. Cross-sections near the posterior and anterior ends of the hlx-1 stripe in the same 9-10 hpf embryo are shown in A and B, respectively. Arrows indicate the location of a ventral layer of presumptive endodermal cells where transcripts are not detected. Cross-sections in the diencephalic region of 12 and 16 hpf embryos are shown in C and D, respectively. Bar, 30 µm. Abbreviations: dc, diencephalon; ep, epiblast; hp, hypoblast; ov, optic vesicle; p, polster; y, yolk.
Figure Data
Acknowledgments
This image is the copyrighted work of the attributed author or publisher, and
ZFIN has permission only to display this image to its users.
Additional permissions should be obtained from the applicable author or publisher of the image.
Full text @ Development