
|
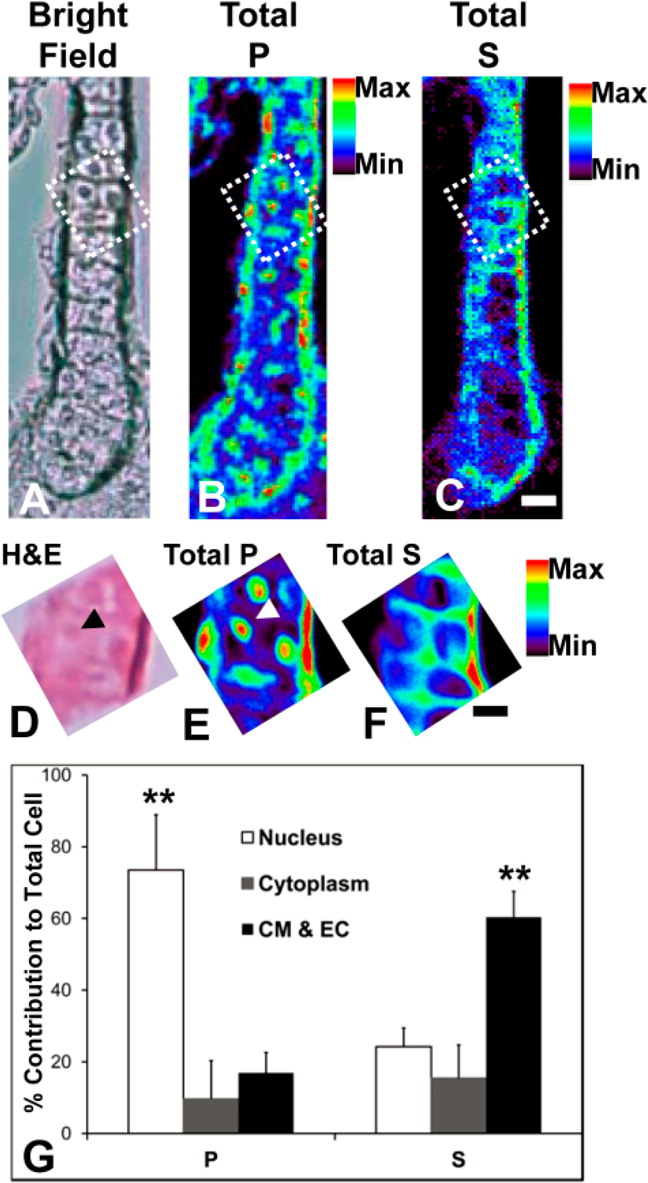
Fig. 4
XFI of cartilage in larval zebrafish reveals subcellular compartmentalization. (A) Bright field imaging of the unstained cartilage prior to XFI analysis. (B and C) XFI elemental map of total phosphorus (P) and sulfur (S) distributions at 1 µm steps within cartilage. (D) H&E histology of the region analyzed at high resolution, which is outlined by a dashed line in panel A. (E and F) High-resolution (100 nm beam size and steps) XFI analysis of the P and S subcellular distribution in cartilage. (G) Quantification of P and S concentrations within subcellular compartments of cartilage (CM, cell membrane; EC, extracellular matrix). A Student’s t test at the 95% confidence limit was used to test for significant differences between groups. *p < 0.05, and **p < 0.01. Scale bars are 10 µm in panel C and 5 µm in panel F.