
|
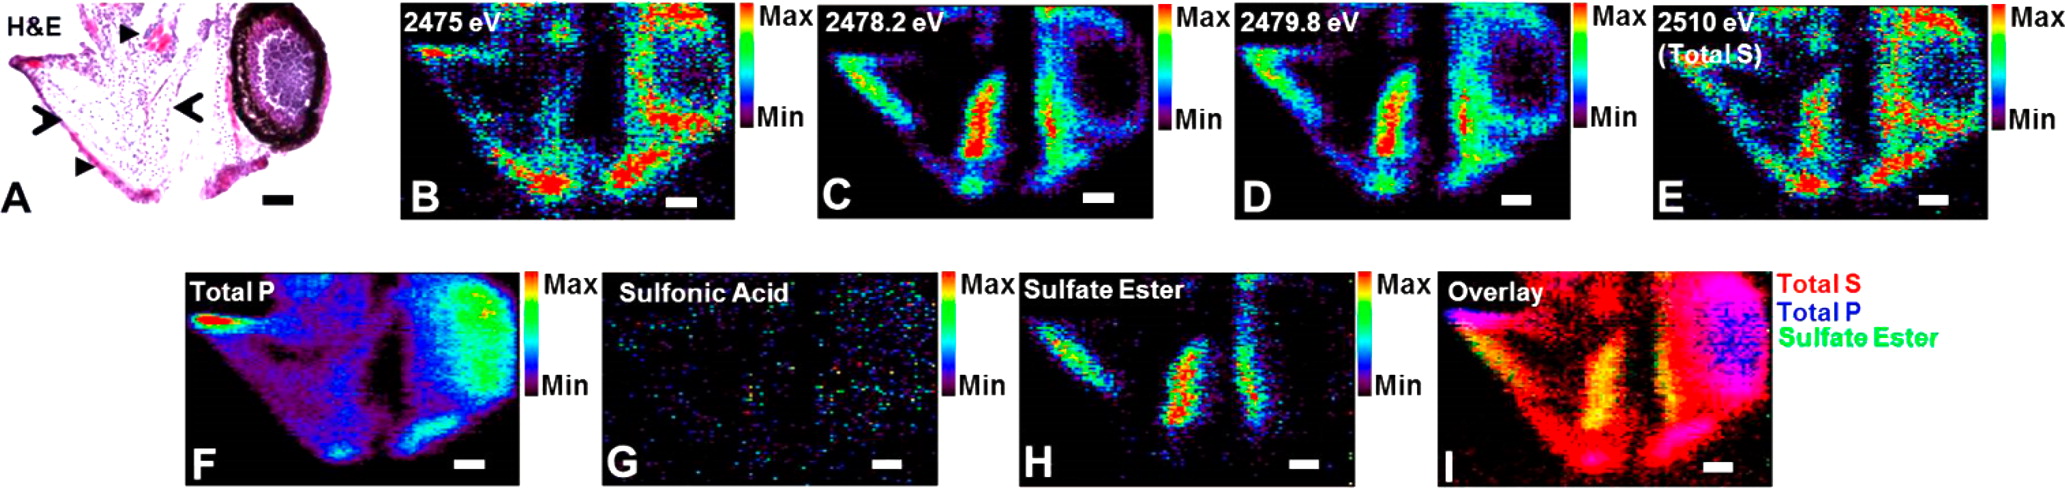
Fig. 3
Chemically specific imaging reveals the distribution of O-linked sulfate esters. Because of the characteristic shifts in the edge position and intensity of different chemical forms of sulfur, multienergy chemically specific imaging can be performed to elucidate the distribution of specific chemical forms of sulfur (i.e, O-linked sulfate esters). In this example, two chemical forms of sulfur are revealed using a four-energy imaging approach. (A) H&E stain. (B–E) Sulfur XFI maps at four specified energies: (B) 2475 eV, background; (C) 2478.2 eV, white line position of sulfonic acid; (D) 2479.8 eV, white line position of sulfate ester; (E) 2510 eV, total sulfur, displayed on a relative intensity scale. (F) Total phosphorus, measured simultaneously with sulfur. (G and H) Chemically specific images, displayed on a common intensity scale, of sulfonic acid and O-linked sulfate esters, respectively. (I) Overlay of total sulfur (red), total phosphorus (blue), and sulfate esters (green). Empty arrowheads indicate the locations of cartilage, and filled arrowheads indicate the locations of muscle tissue (intense pink eosin staining). The scale bar is 10 µm.