
Image
|
Figure Caption
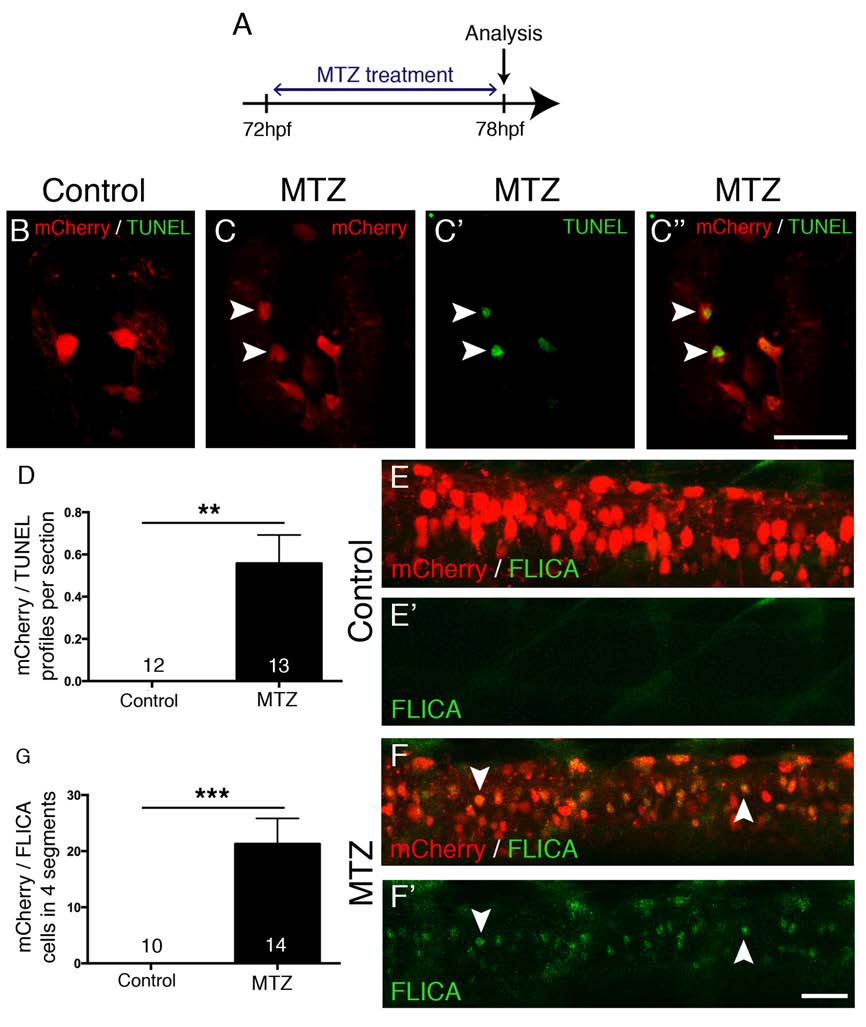
Fig. S7
MTZ treatment leads to apoptosis. A: The experimental time line is shown. B-D: Spinal cross sections are shown. During MTZ treatment, mCherry+ cells become TUNEL positive in transgenic, but not in control treated larvae, quantified in D (Mann-Whitney U-test, **p = 0.0039). E-G: Lateral views are shown; dorsal is up, rostral is left. mCherry+ cells become FLICA positive during MTZ treatment (F, F′), but not control treatment (E, E′), quantified in G (Mann-Whitney U-test, ***p = 0.0001). Scale bar in C′′ = 25 µm for B-C′′, in F′ = 50 µm for E-F′.
Acknowledgments
This image is the copyrighted work of the attributed author or publisher, and
ZFIN has permission only to display this image to its users.
Additional permissions should be obtained from the applicable author or publisher of the image.
Full text @ Development