
Fig. 5
- ID
- ZDB-IMAGE-160523-6
- Genes
- Publication
- de Bruin et al., 2016 - Genome-wide analysis reveals NRP1 as a direct HIF1α-E2F7 target in the regulation of motorneuron guidance in vivo
- All Figures
- Figures for de Bruin et al., 2016
|
Fig. 5
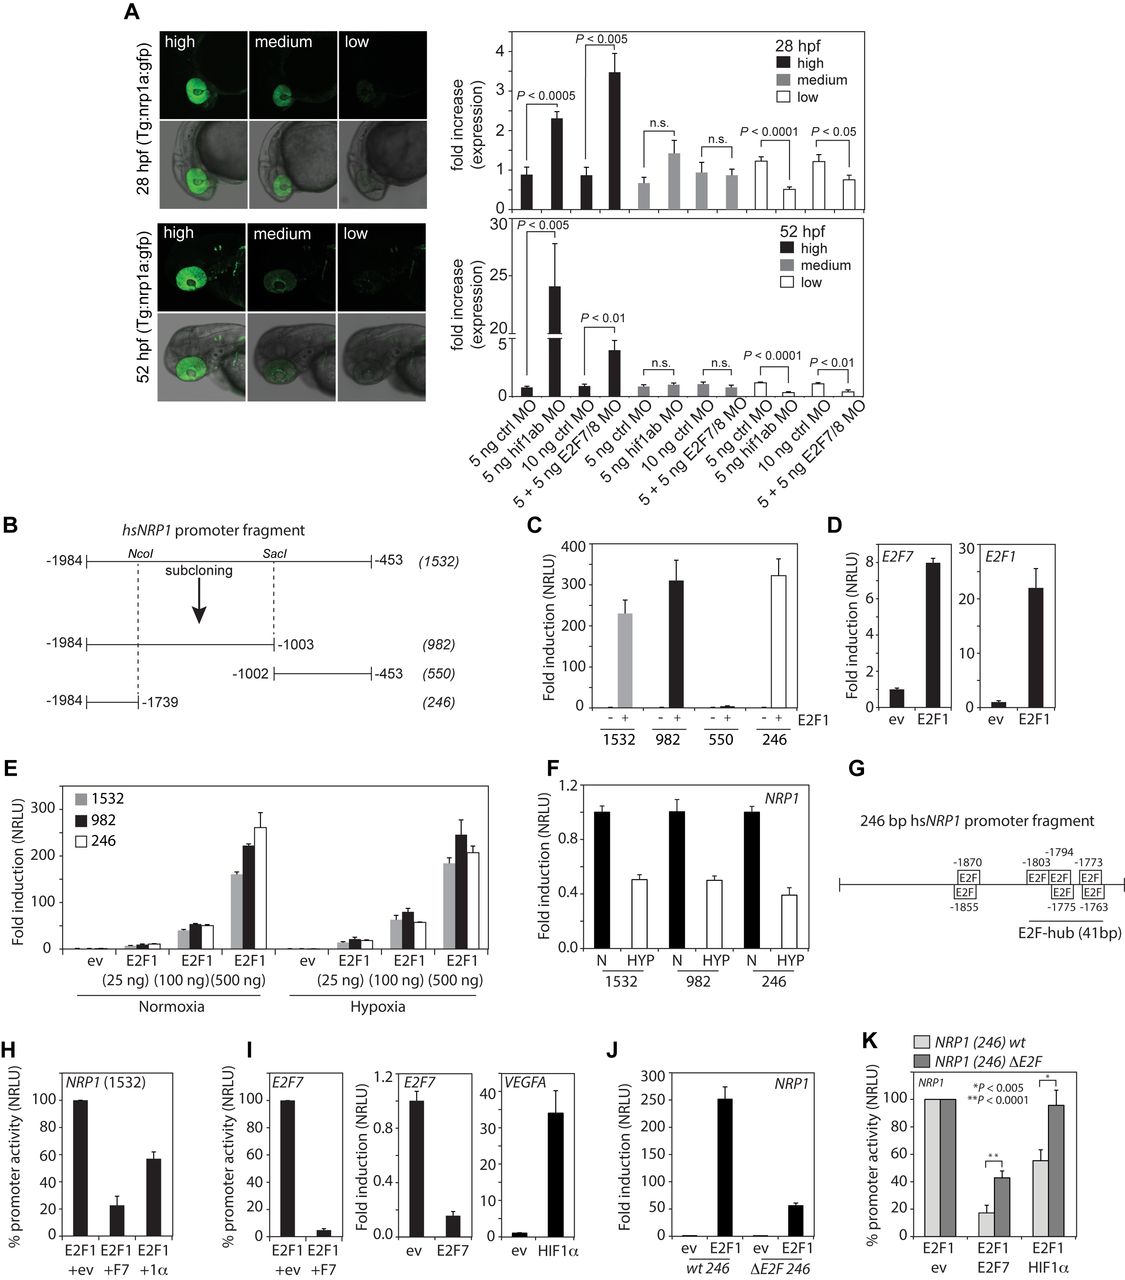
The HIF1α-E2F7 complex regulates NRP1 through an E2F-hub. (A) Left panels show confocal images of the head region of Tg(nrp1a:gfp)js12 zebrafish at 28 and 52 hpf. Fish are divided in three groups (high, medium, low) based on the level of transgene expression in the eye (showing 2 examples per group). Graphs present quantification of the three groups at the indicated times after injection of control MO, e2f7/8 MO (5 + 5 ng) or hif1α MO (5 ng) in zebrafish embryos (n ≥ 154 embryos in ≥ 4 independent experiments for each specific condition). (B) Schematic figure of the cloned 1532 bp human NRP1 promoter, and promoter regions subcloned from it, using NcoI and SacI restriction sites. (C) Luciferase reporter assays showing the fold induction of normalized relative luciferase units (NRLU) of different NRP1 promoter constructs by E2F1 compared to controls. (D) Similar as in (C) but now for the E2F1 control promoters E2F7 and E2F1. (E) Reporter assay showing the dose-dependent induction of the NRP1 promoter activity by different amounts of E2F1. (F) Reporter assay comparing the activity of the indicated NRP1 promoter constructs in hypoxia compared normoxia. (G) Representation of the 246 bp NRP1 promoter and putative E2F binding sites as identified by MatInspector. HIF binding sites were not identified in the 246 bp fragment. (H) Reporter assay showing activity of the 1532 bp NRP1 promoter in the presence of E2F1 alone (set at 100%) or together with E2F7 or HIF1α (1α). (I) Control reporter assays showing regulation of the E2F7 promoter (left panel) promoter in the presence of E2F1 alone (set at 100%), or together with E2F7. Middle and right panels show positive controls to check for functional E2F7 or HIF1 activity using E2F1 or VEGFA promoter constructs respectively. (J) Reporter assay showing induction of the wild-type and theΔE2F-hub NRP1 promoter by E2F1 compared to controls. (K) Similar as in (H) but now for the wildtype or 41 bp E2F-hub deleted (ΔE2F) 246 bp NRP1 promoter. All quantified data present the average ± S.D. (except for (A) in which the average ± S.E.M. as shown) compared to the indicated controls in at least three independent experiments.