
|
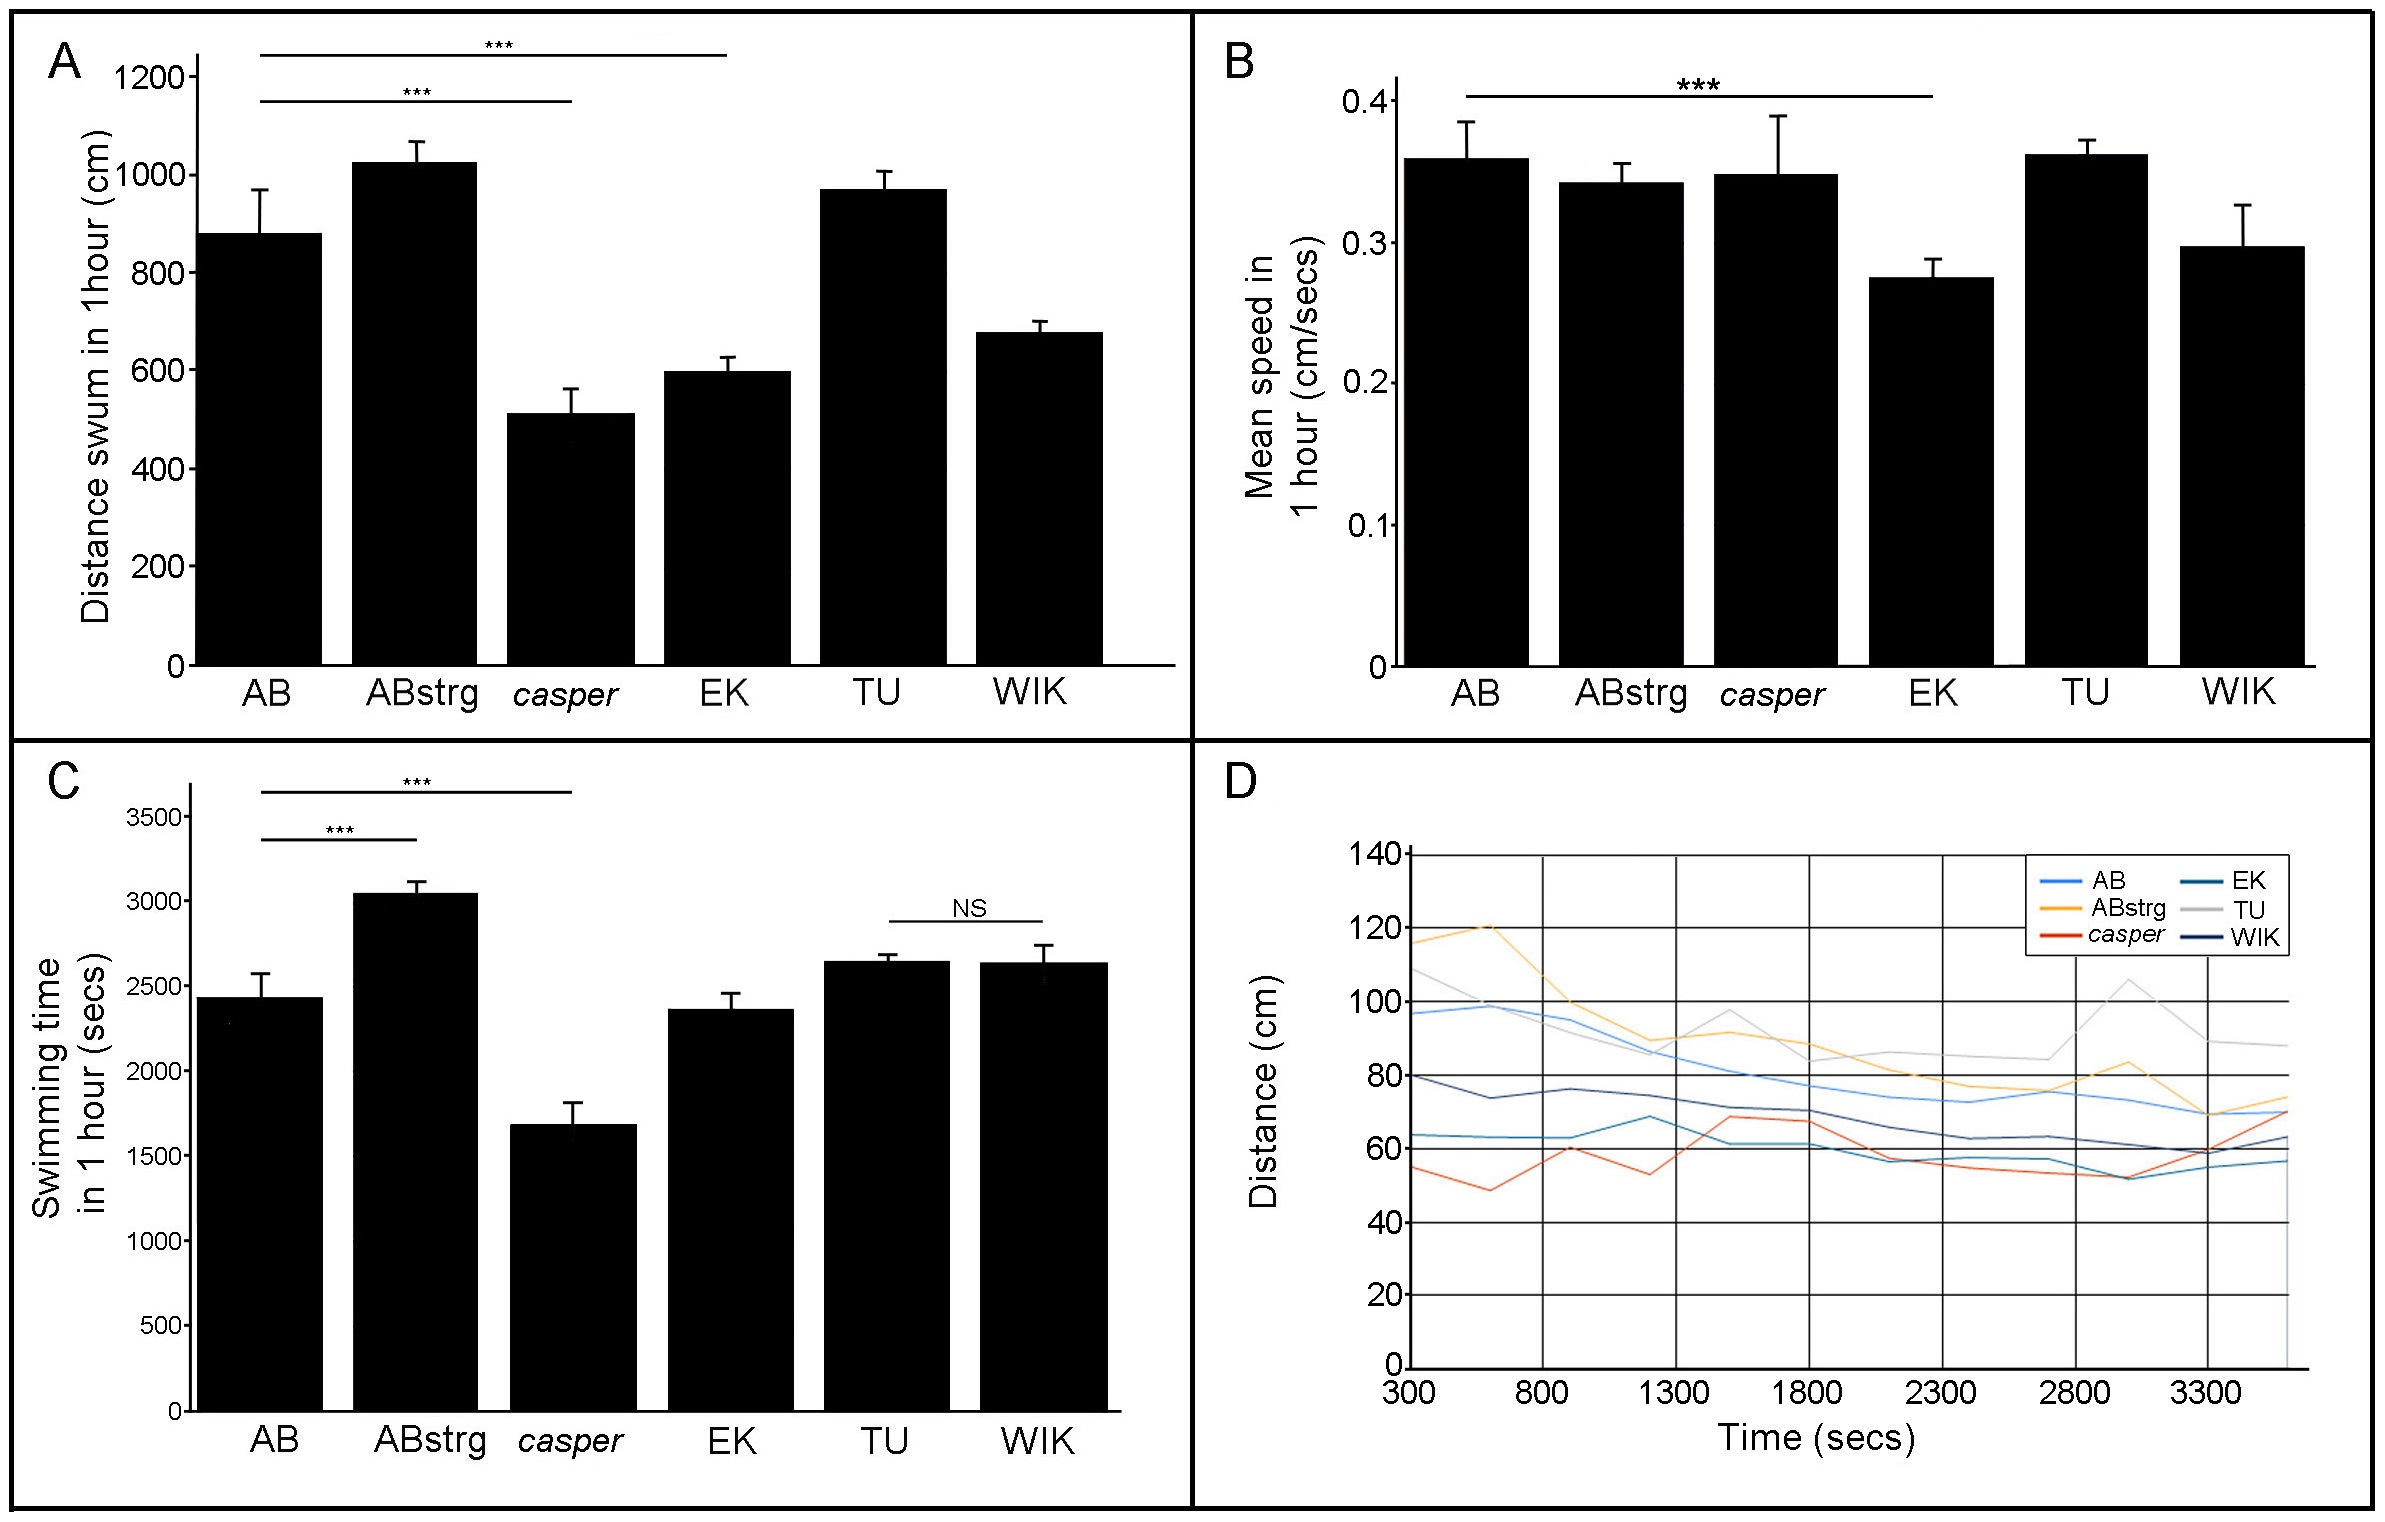
Fig. 1
Locomotory behaviour of six zebrafish strains at 6 days post fertilisation.
A) Mean distance swum in a 60-minute time interval by 6 day-old AB, ABstrg, casper, EK, TU and WIK larvae. casper, EK and WIK larvae swam significantly less than AB, ABstrg or TU. For the statistics refer to table 2. AB n = 47; ABstr n = 94; casper n = 47; EK n = 90; TU n = 47 and WIK n = 93. B) Mean swimming speed of 6 day-old AB, ABstrg, casper, EK, TU and WIK larvae during a 60-minute experiment. EK and WIK larvae swam significantly slower than the other fish strains. For the statistics refer to table 2. AB n = 47; ABstr n = 94; casper n = 47; EK n = 90; TU n = 47 and WIK n = 93. C) Mean time spent swimming during a 60-minute experiment for 6 day-old AB, ABstrg, casper, EK, TU and WIK larvae. ABstrg swam significantly more than all other fish strains. casper swam significantly less than all other fish strains. EK swam significantly less time than ABstrg, WIK and TU, and significantly more than casper. For the statistics refer to table 2. AB n = 47; ABstr n = 94; casper n = 47; EK n = 90; TU n = 47 and WIK n = 93. D) The distance swum every 5 minutes for each strain as function of time. Values are plotted every 300 seconds in a 60-minute experiment for 6 day-old AB, ABstrg, casper, EK, TU and WIK larvae. AB, ABstrg and EK fish show smoother locomotion curves than casper, TU and WIK. For the statistics refer to table 1. AB n = 47; ABstr n = 94; casper n = 47; EK n = 90; TU n = 47 and WIK n = 93.