
|
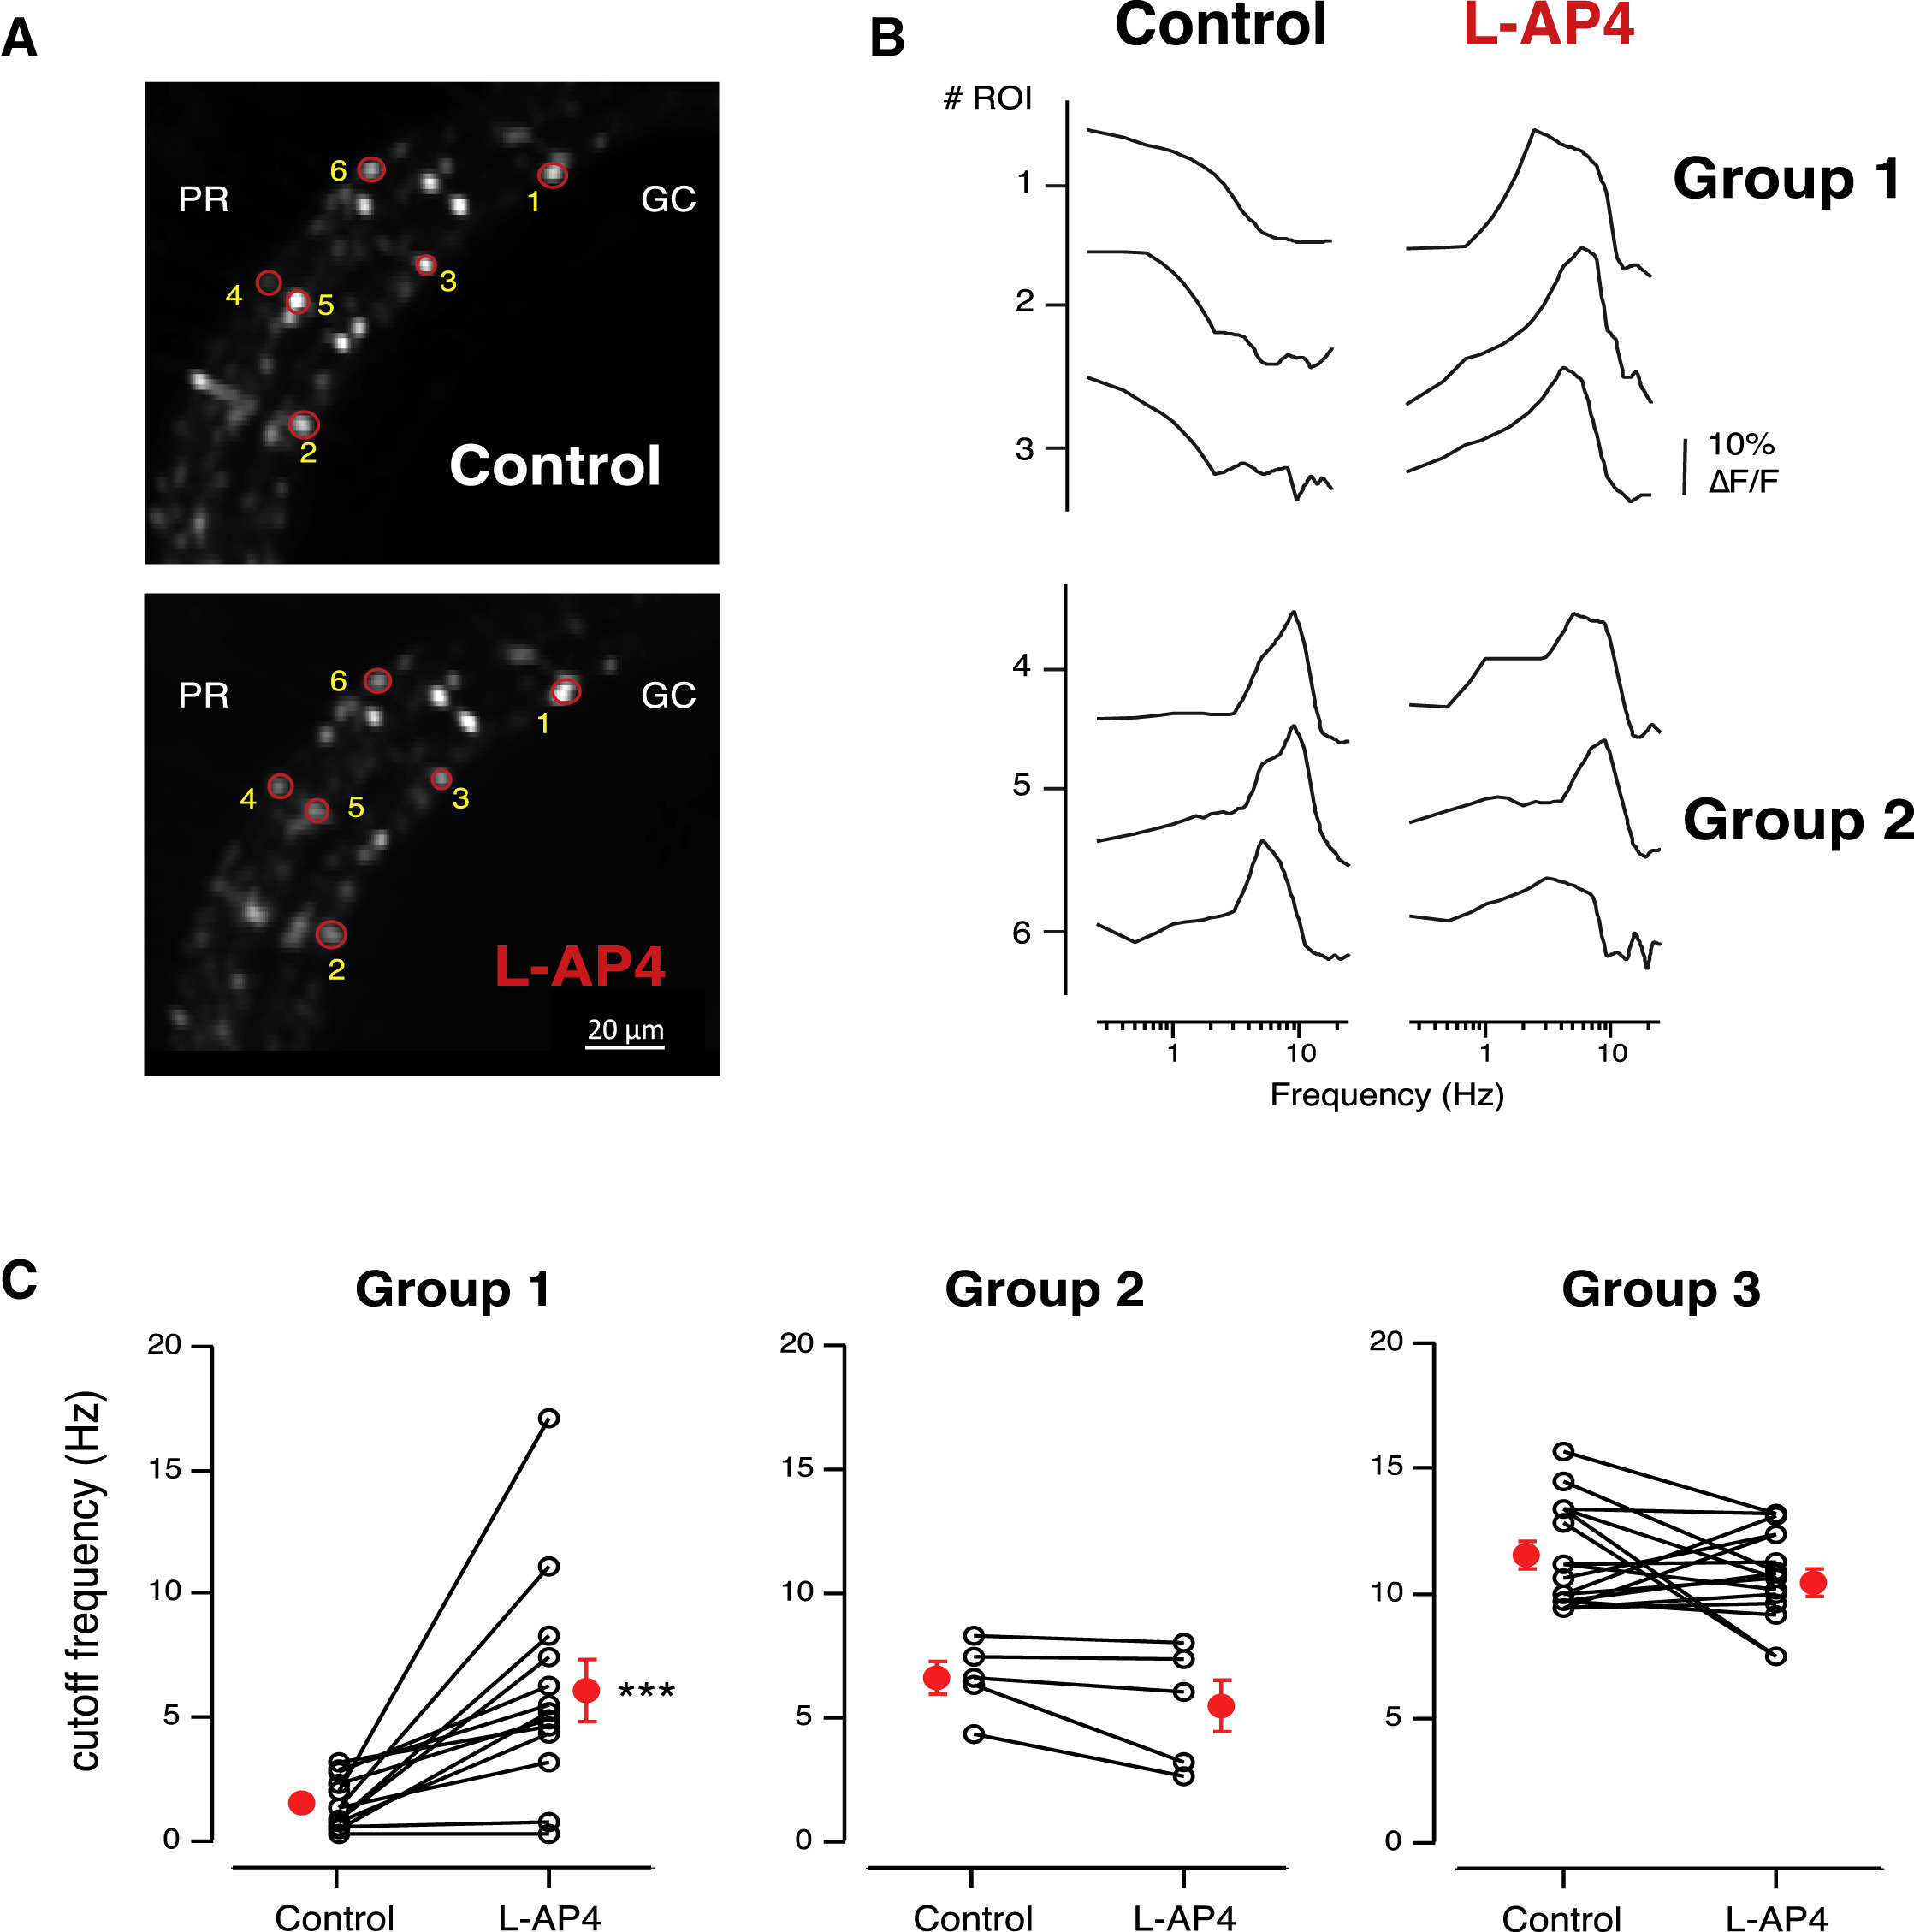
Fig. 4
Crossover Inhibition Converts Band-Pass Terminals to Low-Pass
(A) A field of view showing the same population of bipolar cell terminals before and after the injection of L-AP4 into the eye of a zebrafish.
(B) Example of frequency tuning curves from three individual terminals from Group 1 (ROIs 1, 2, and 3 in A) and three from Group 2 (ROIs 4, 5, and 6) before and after L-AP4.
(C) Summary of the cutoff frequency values from all the OFF bipolar terminals in each group before and after L-AP4 (n = 34 terminals from 1 fish). Groups in control conditions were determined by K-means clustering (see Experimental Procedures). The cutoff frequency from the individual terminals was calculated as in Figure 1. Solid lines connect responses from the same terminals before and after L-AP4. Red dots represent mean ± SEM. p < 0.001.