
IMAGE
Fig. S4
- ID
- ZDB-IMAGE-160513-8
- Publication
- Andrews et al., 2016 - Visualising apoptosis in live zebrafish using fluorescence lifetime imaging with optical projection tomography to map FRET biosensor activity in space and time
- All Figures
- Figures for Andrews et al., 2016
Image
|
Figure Caption
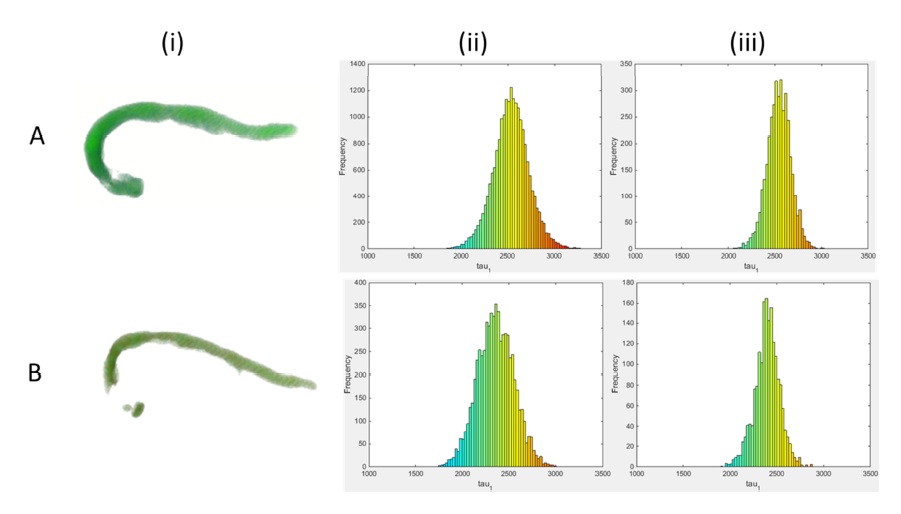
Fig. S4
24 hpf Tg(Ubi:SECFP) zebrafish embryos were irradiated with 25 Gy and imaged at 3.5 hours post irradiation. Data was fitted using FLIMfit. i) False colour intensity merged lifetime map of Tg(Ubi:SECFP): A) irradiated, B) non-irradiated; ii-iii) corresponding pixel lifetime histograms, generated in FLIMfit: ii) segmented head, iii) segmented tail.
Acknowledgments
This image is the copyrighted work of the attributed author or publisher, and
ZFIN has permission only to display this image to its users.
Additional permissions should be obtained from the applicable author or publisher of the image.
Full text @ J. Biophotonics