
|
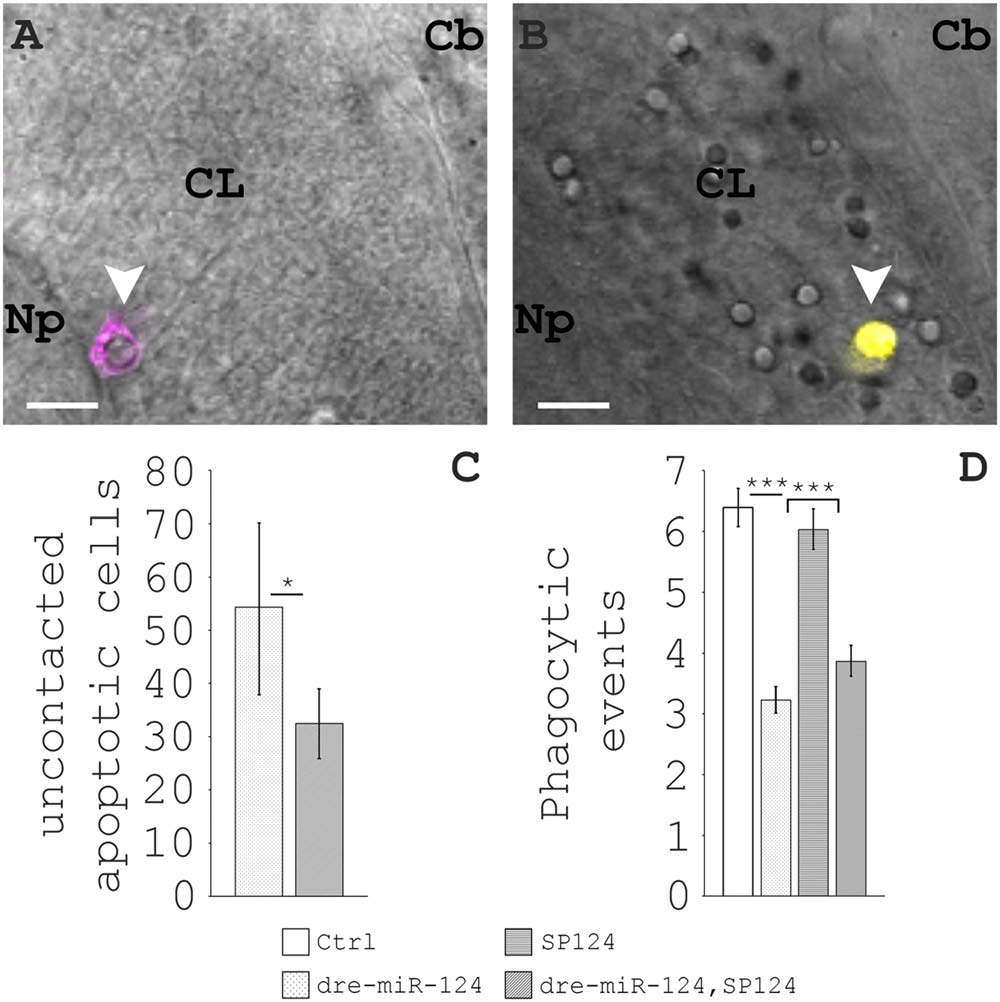
Fig. 4
Successful microglial scavenging versus left over apoptotic cells. A: Representative region of the optic tectum of an mpeg1:mCherry-CAAX larva at 5dpf. The arrow indicates an apoptotic cell which stands out from the cell layer background, the magenta coloured signal is a microglial process engulfing the cell. B: A representative region of the optic tectum of an mpeg1:Gal4, UAS:YFP-dre-miR-124-1 larvae at 5dpf. Many free-lying apoptotic cells are present on top of the cell layer, the yellow signal is a microglial process in contact with a dead cell. CB, cerebellum, CL, cell layer, Np, neuropil. Scale = 10 µm. C: Residual apoptotic cell body counts for the miR-124 overexpression and rescue in larvae when ≥10 occurred in one or both tectal hemispheres. D: Phagocytic profile of microglia in the optic tectum over the 3-7dpf period. Control microglia, CI: 6.08-6.7; miR-124 overexpressing, CI: 3.01-3.45; miR-124 sponge, CI: 5.7-6.37; rescue, CI: 3.62-4.13.