
|
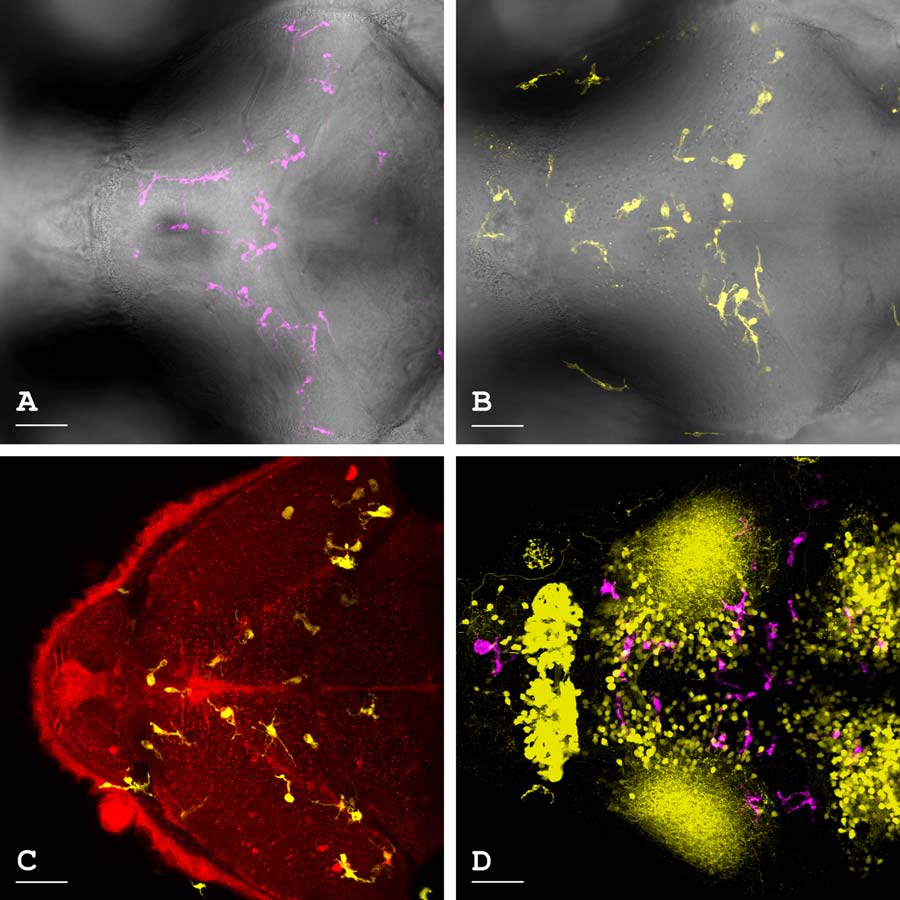
Fig. 2
Examples of transgene expression. A: mpeg1:mCherry-CAAX that induced mCherry expression in microglia of the optic tectum. B: mpeg1:Gal4, UAS:YFP-dre-miR-124-1 in microglia of the optic tectum. C: mpeg1:Gal4, UAS:YFP-dre-miR-124-1 (miR-124 expression in microglia) on a ubiquitous mCherry and miR-124 sponge expression background. Note, βactin:mCherry-SP124, mpeg1:eGFP (miR-124 sponge) is identical to this expression with eGFP in place of the YFP-dre-miR-124-1. D: mpeg1:mCherry-CAAX expressing mCherry in microglia of the optic tectum with elavl3 driven YFP-dre-miR-124-1. No clear morphology differences were observed between the transgenic models. Subparts (A) and (B) are maximum intensity projections of the fluorophore channel overlaid on a single slice in the bright field channel at 5 and 6dpf, (C) is a maximum intensity projection of the YFP channel (representing the microglial dre-miR-124-1 and YFP expression) overlaid on a single slice from the mCherry channel (representing βactin driven mCherry and sponge expression) at 5dpf, and (D) is a maximum intensity projection of the microglial mCherry expression and the elavl3 driven dre-miR-124-1 and YFP expression at 6dpf. Scale = 50µm.