
|
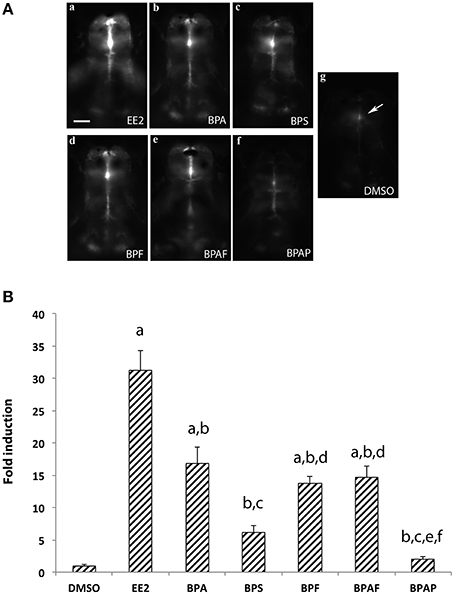
Fig. 2
(A) In vivo imaging of 4-dpf old live transgenic cyp19a1b-GFP zebrafish larvae exposed to EE2, BPA, and various bisphenol A analogs.For each chemical the concentration used is 1 µM excepted for EE2 (1 nM) and the vehicle (DMSO). Dorsal views of the brains. Anterior is to the top. Bar = 20 µm. (B) Quantification of GFP fluorescence in zebrafish larvae exposed to the various compounds. Results are expressed as fold induction above control. Data re presented as mean ± SEM of 20 specimens per condition (n = 20). a: p < 0.05 vs. DMSO; b: p < 0.05 vs. EE2, c: p < 0.05 vs. BPA, d: p < 0.05 vs. BPS, e: p < 0.05 vs. BPF, f: p < 0.05 vs. AF.