
|
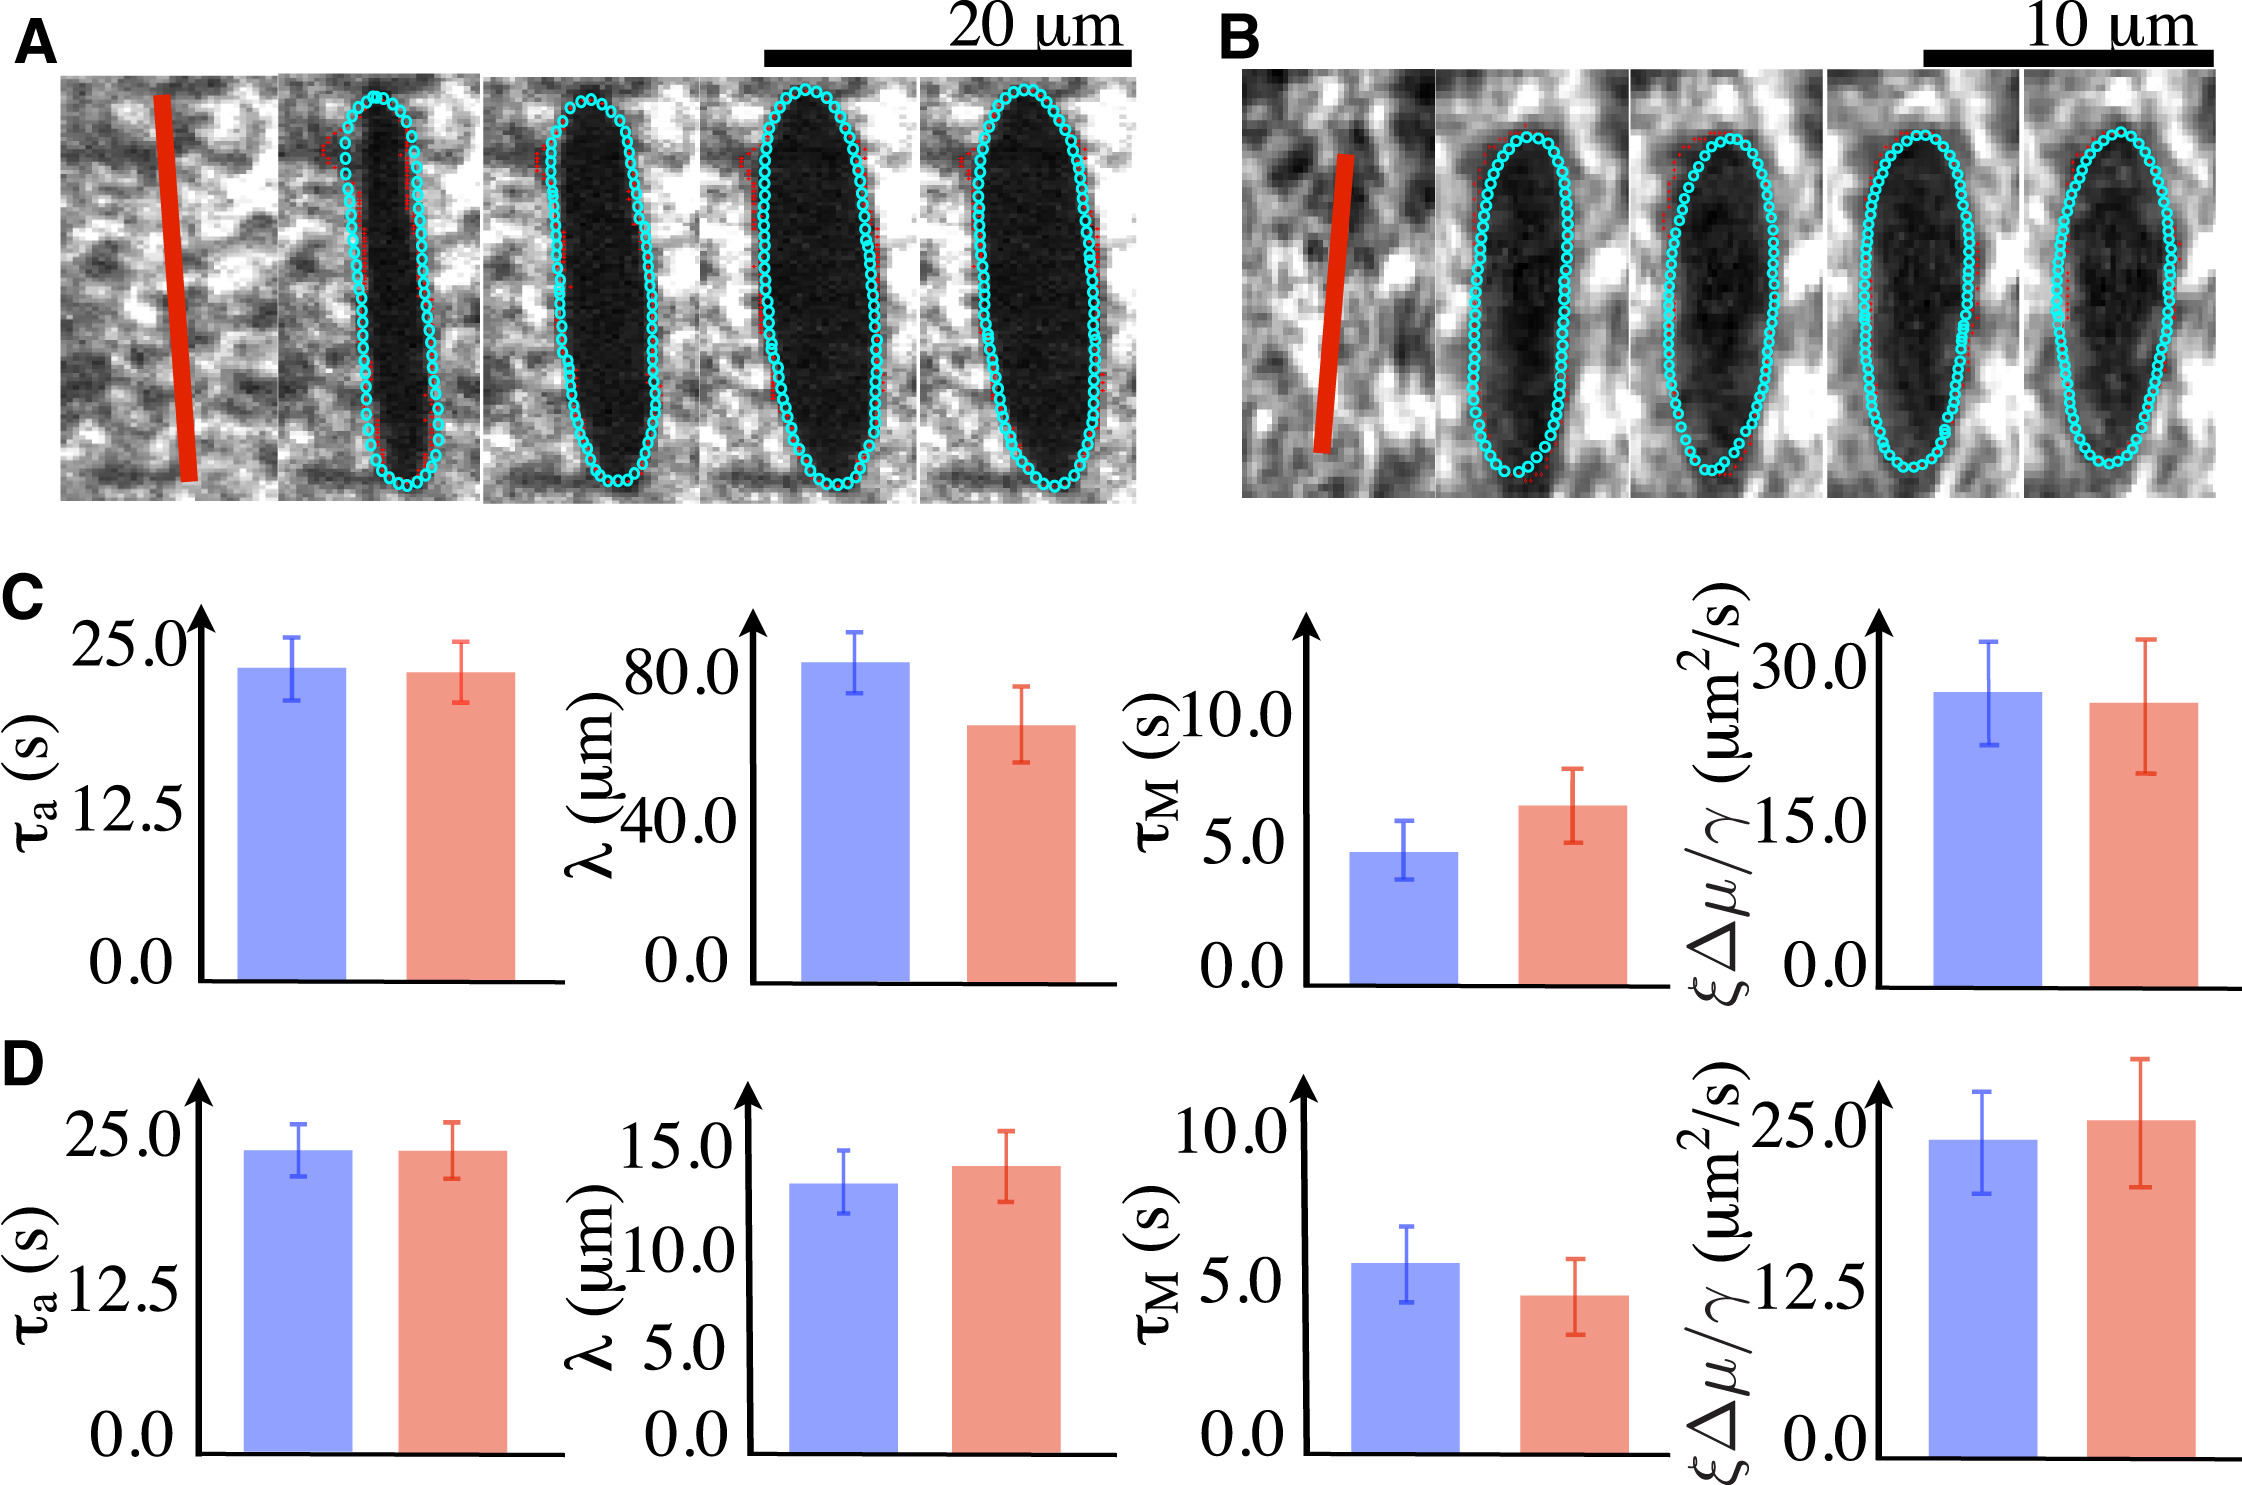
Fig. 4
Determination of physical parameters by comparing the COLA responses observed in experiment to the computed response from the theory. (A and B) Representative examples of fitting the cut opening boundary in response to COLA of the actomyosin ring in zebrafish during epiboly (A) and the cortex in a single-cell embryo of C. elegans (B). (Red points) Automatically detected boundaries of the cut opening. Distances between the computed and the detected boundaries were minimized to find the best-fit parameter values. (Cyan) The theoretical boundaries that best fit the experimental ones. Images are 1 s apart. (C and D) Comparison of physical parameter values between the two methods utilized. (Red) The best-fit parameter values were determined by comparing the experimentally determined regrowth of the cut region, spatial decay of the outward velocity profile, and the time evolution of the cut opening boundary to theoretical prediction (see Fig. 2). (Blue) The best-fit parameter values obtained by comparing the cut opening boundaries between experiment and theory (see A and B). Note that both fitting procedures converge to similar values. Error bars are the 95% confidence interval of the mean with n = 15 for zebrafish and n = 10 for C. elegans.