
IMAGE
Fig. 1
- ID
- ZDB-IMAGE-160407-9
- Publication
- Zhang et al., 2016 - A Naturally-Derived Compound Schisandrin B Enhanced Light Sensation in the pde6c Zebrafish Model of Retinal Degeneration
- All Figures
- Figures for Zhang et al., 2016
Image
|
Figure Caption
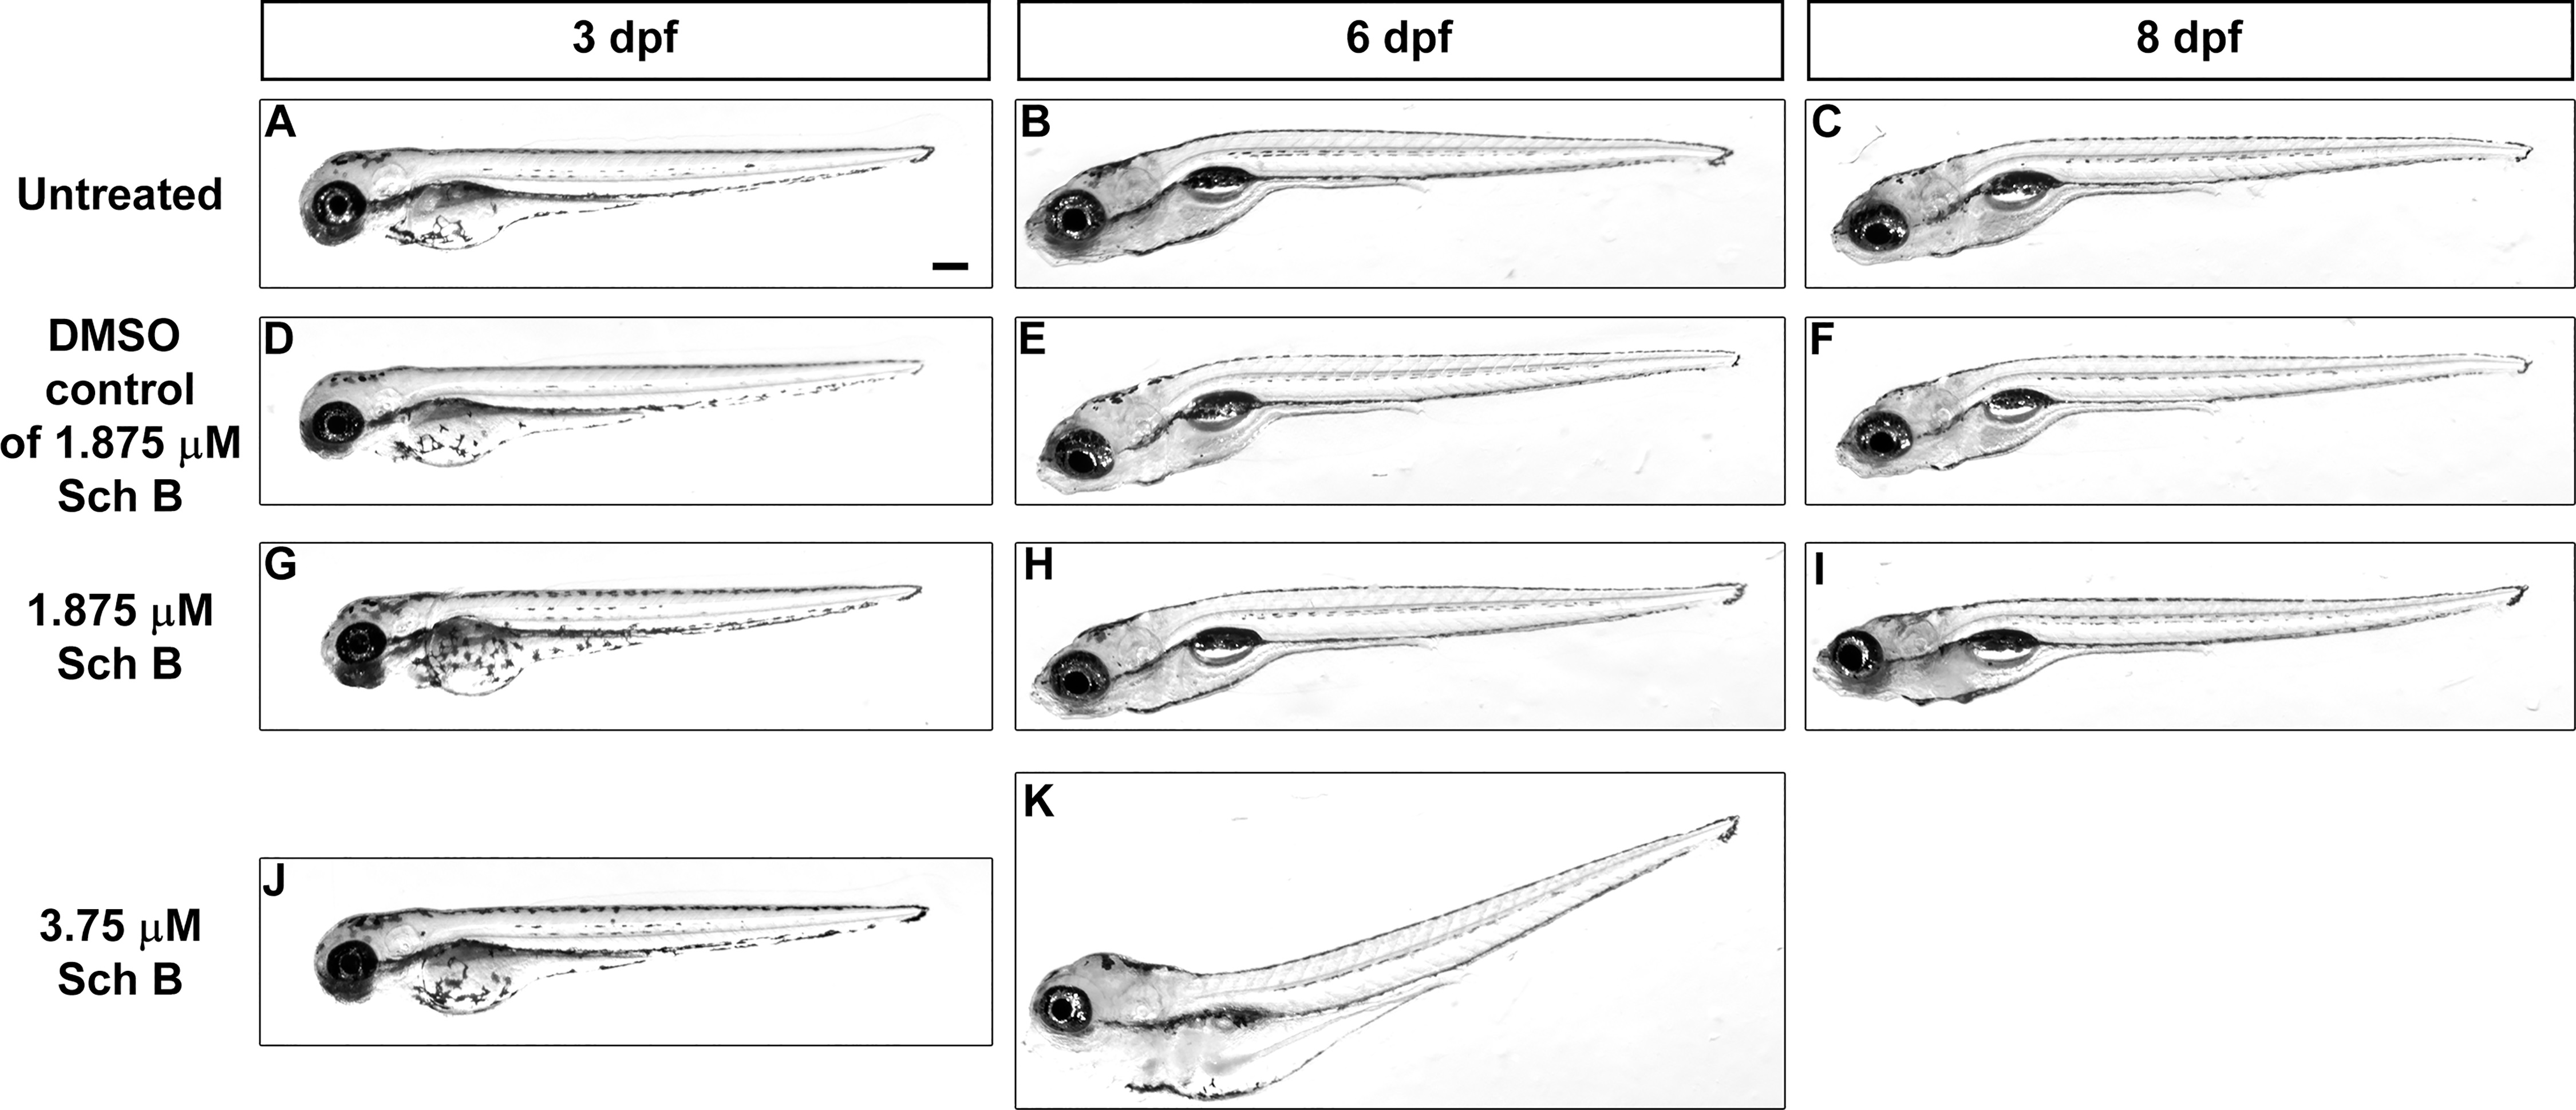
Fig. 1
Optimization of SchB concentration for treating zebrafish larvae.The gross morphology of zebrafish larvae under different treatment schemes from 3 to 8 dpf. (A-C) untreated controls; (D-F) larvae exposed to the same volume of DMSO carrier as in the 1.875 µM SchB treatment; (G-I) larvae exposed to 1.875 µM SchB; (J-K) larvae exposed to 3.75 µM SchB. In each treatment group, the lateral view of a representative larva at 3, 6 and 8 dpf is shown. Larvae exposed to higher SchB concentrations, including 7.5 and 15 µM, died relatively rapidly (Table 1); hence, these samples are not shown here. Scale bar = 200 µm.
Acknowledgments
This image is the copyrighted work of the attributed author or publisher, and
ZFIN has permission only to display this image to its users.
Additional permissions should be obtained from the applicable author or publisher of the image.
Full text @ PLoS One