
Fig. S6
- ID
- ZDB-IMAGE-160405-9
- Publication
- Webb et al., 2016 - Persistence, period and precision of autonomous cellular oscillators from the zebrafish segmentation clock
- All Figures
- Figures for Webb et al., 2016
|
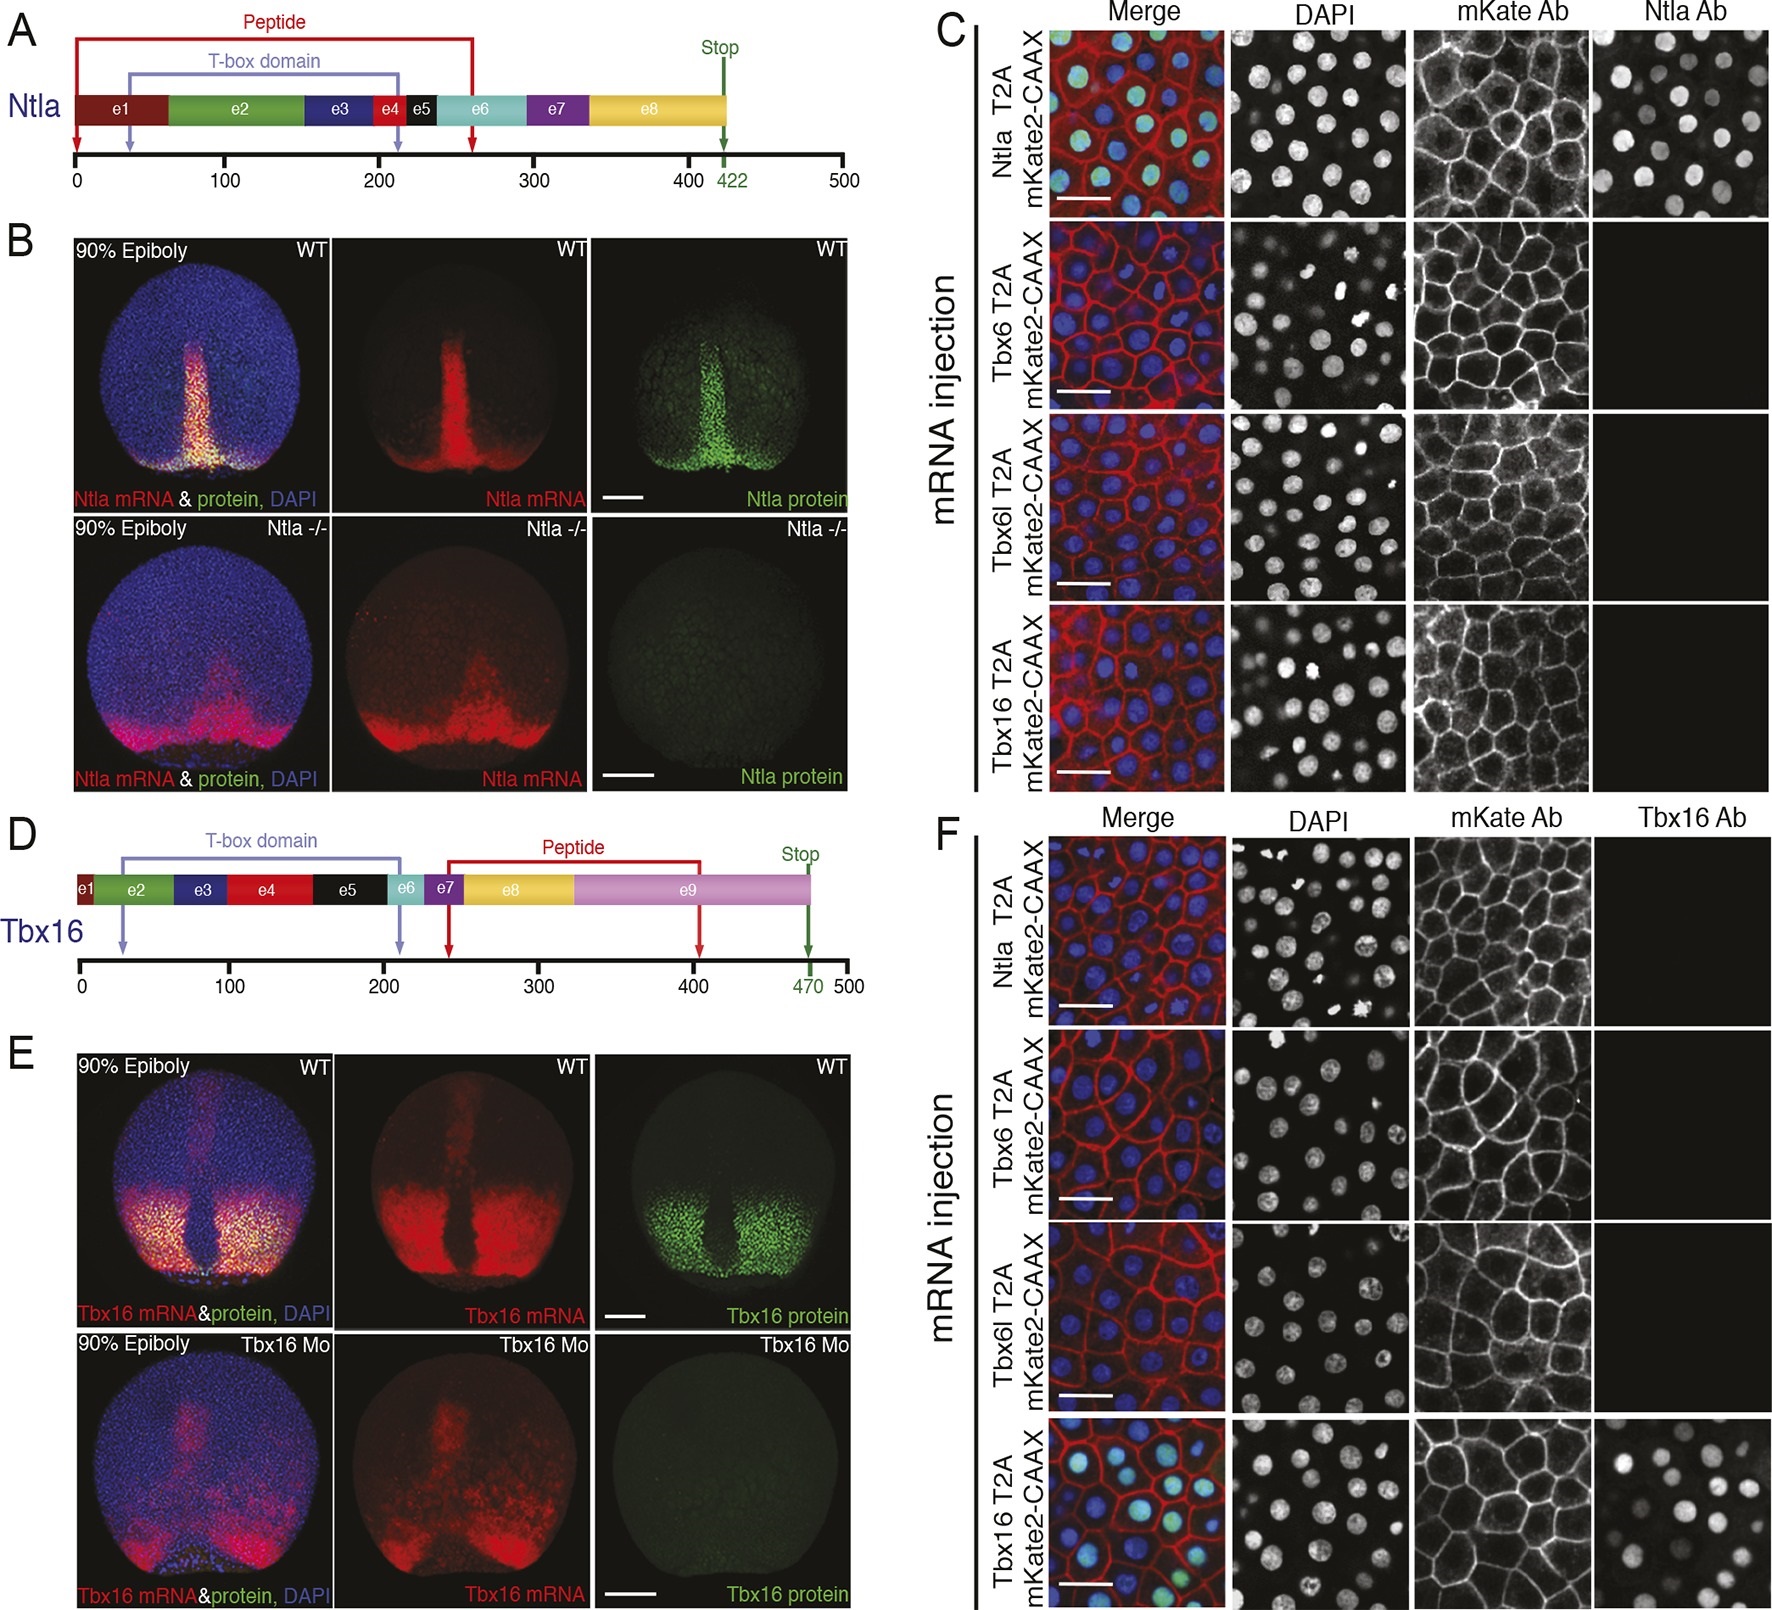
Fig. S6
Characterization of Ntla and Tbx16 antibodies. (A, D) Graphical representation of the full-length Ntla and Tbx16 proteins with exons depicted in different colors. Blue arrows show the predicted T-box domain from amino acid 35 to 212, and 31 to 213, for Ntla and Tbx16 respectively. The Ntla antibody (clone D18-4, IgG1) was generated using a peptide from amino acid 1 to 261, while the corresponding sequence for the Tbx16 antibody (clone C24-1, IgG2a) spans the region from amino acid 232 to 405 (bracketed in red in both cases). (B, E) Representative examples showing ntla mRNA and protein expression patterns in wild type and in ntla mutant embryos at 90% epiboly. Immunolabeling using the Ntla antibody was followed by in situ hybridization using a ntla riboprobe. The same procedure was used to characterize the Tbx16 antibody except that wild type embryos are compared to tbx16 morpholino-injected embryos and a tbx16 riboprobe was used. Scale bar = 150 µm. (C, F) Immunolabeling of wild type embryos injected at 1-cell-stage with capped mRNAs (Ntla-T2A-mKate2CAAX, Tbx6-T2AmKate2CAAX, Tbx6l-T2A-mKate2CAAX or Tbx16-T2A-mKate2CAAX), fixed at 4 hr post fertilization and imaged at the animal pole where the endogenous genes are not expressed. Both Ntla (C) and Tbx16 (F) antibodies bind only in embryos injected with ntla and tbx16 mRNA respectively, demonstrating antibody specificity. Scale bar = 20 µm.