
|
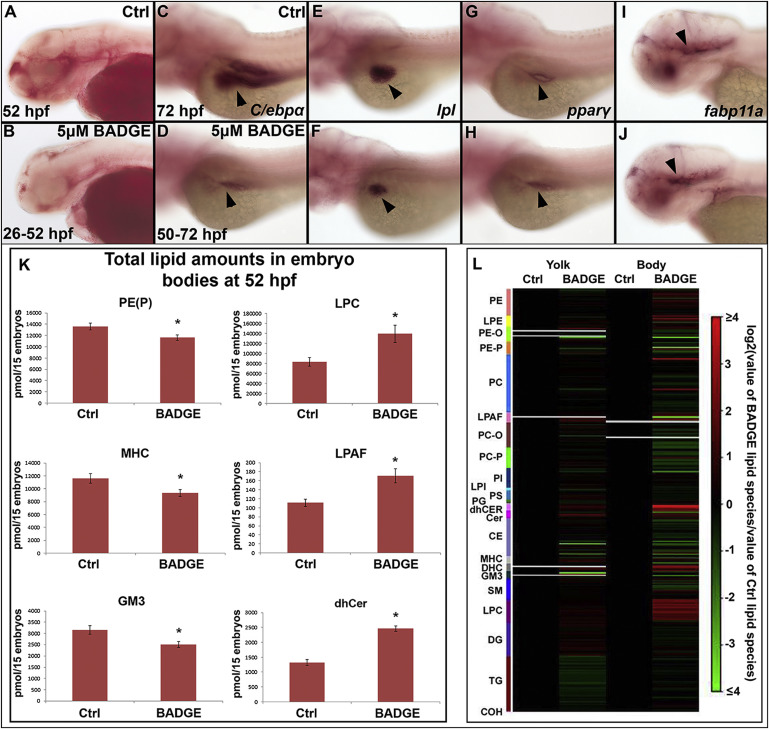
Fig. 4
The Effects of PPARγ Inhibition on the Lipid Profile and Gene Expression of Zebrafish Embryos
(A and B) ORO staining showed decreased lipid present in embryos treated with 5 µM BADGE from 26-52 hpf (B) compared with controls (A).
(C-J) Treatment with 5 µM BADGE from 50-72 hpf decreased the expression of c/ebpα (C and D, arrowheads) and lpl (E and F, arrowheads), did not affect the expression of pparγ (G and H, arrowheads) and increased the expression of fabp11a (I and J, arrowheads).
(K) Lipid amounts are depicted for lipid categories that were significantly changed by exposure to 5 µM BADGE from 26-52 hpf. Lipid species concentrations are shown in pmol/15 embryos (K). The amount of each individual lipid at a single time point in 5 µM BADGE-treated embryos was set relative to the level of that lipid species in control embryos. * p < 0.05.
(L) A log2 ratio was then calculated for the signals of each lipid species. Red indicates an increase compared to the mean, green indicates a decrease and black shows no change. Gray is displayed when there is no lipid present.
See also Figure S4.