
|
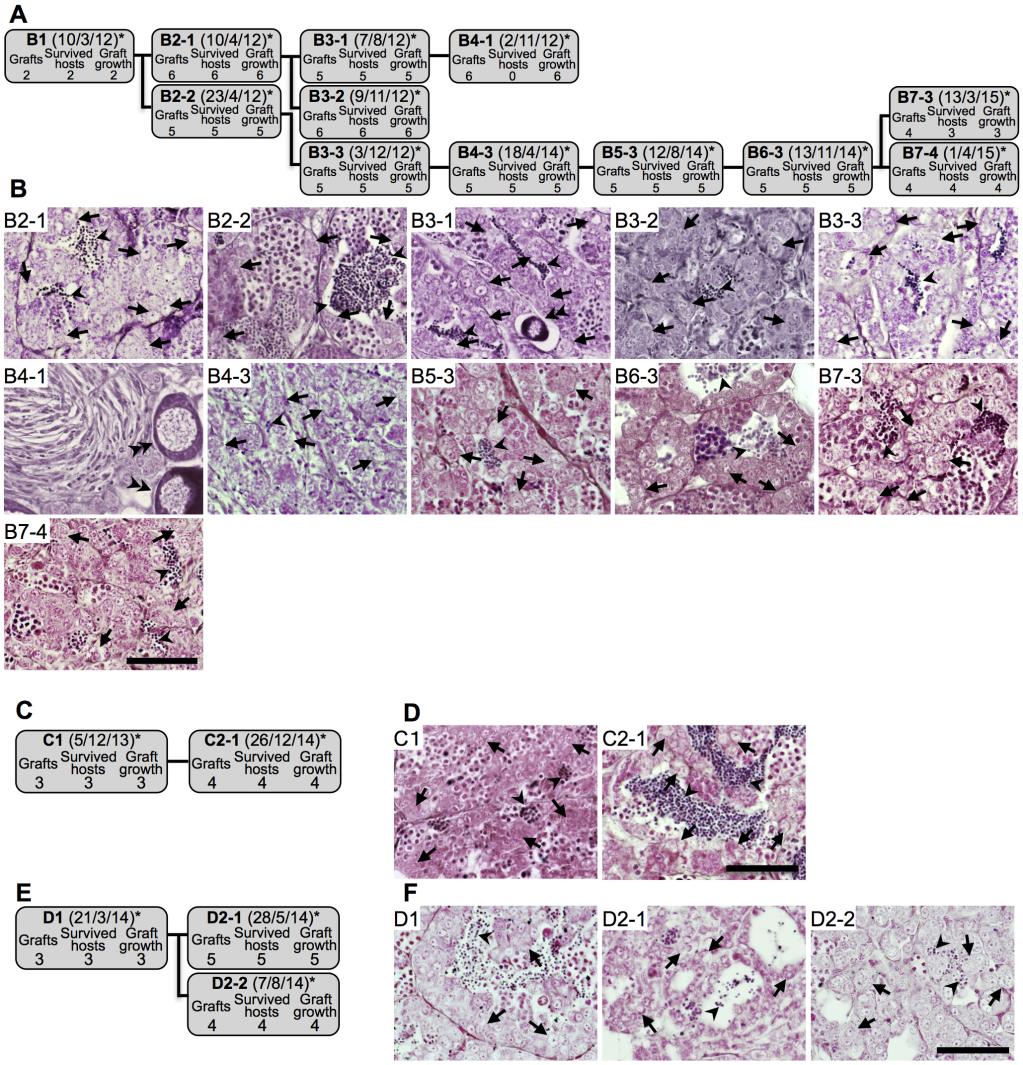
Fig. S3
Sequential transplantations of testicular hyperplasias B-D. (A, B) B series from hyperplasia B; (C, D) C series from hyperplasia C; (E, F) D series from hyperplasia D. In A, C, and E, graft information is provided in the same way as in Figure 2. (B, D, F) Histological observation of grafted testicular hyperplasias. Sections of each testis correspond to grafts of the same serial number shown in panels A, C and E, respectively. The single spermatogonium is indicated by arrows, sperm with arrowheads. Note that spermatogonia were rarely found in B4-1 (fish #1 of the fourth serial transplantation of hyperplasia B). Testis-ova were observed in the B3-1 and B4-1 (double arrowheads). Scale bar, 50µm.